Excel VBA to Libre basic

Can someone please point me to somewhere I can find out how to re-write Excel VBA so it is compatible with Libre Calc.

My VBA is below: (it sums the values of cells with a particular background colour, not sure I need “range” for the cell_color a sit points to a single reference cell for the colour. Please ignore the color/colour differences, I’m in UK so I include the “u”)!

I have a few other “sum” VBA scripts, but once I solve the below, the rest will follow.

Function SumCellsByColor(data_range As Range, cell_color As Range)
Dim indRefColor As Long
Dim cellCurrent As Range
Dim sumRes

Application.Volatile
sumRes = 0
indRefColor = cell_color.Cells(1, 1).Interior.Color
For Each cellCurrent In data_range
If indRefColor = cellCurrent.Interior.Color Then
sumRes = WorksheetFunction.Sum(cellCurrent, sumRes)
End If
Next cellCurrent

SumCellsByColor = sumRes
End Function

Excel and Calc both support conditional formatting, which makes your sample obsolete and your document compatible with both applications.

Honestly, Kevin, I don’t understand your problem. If you have the line
Option VbaSupport 1
at the beginning of the module, then your function will calculate the sum of the colored cells just fine.
Or are you worried that Calc ignores Application.Volatile?

Thanks John, I didn’t know this option existed.
Where exactly do I find this option?
I pasted that line at the top of module, it broke the summing.
I’m using an old version: Office 2010

But, weird that all works fine with Calc on Win10 & Win11, but not on Linux Mint22?
I’ll edit the VBA and copy the file over to my Linux box.
Thanks again.

Thanks Villeroy, I don’t think it’s not conditional formatting (not as understand it, anyway)?
I have 3 bikes that are colour coded, I sum a weeks worth of cycling distance over all 3 colours. But I also have a running total of miles covered for each separate bike (black, green & orange), so I know when certain maintenance is due, based on miles covered. I do not know of a way to do that with conditional formatting.

Just like

Instead of hiding data in formatting attributes (colors) and then read the information from the formatting, you enter the data into cells and get the all the formatting and calculation results automatically.
ask123378.ods (50.0 KB)

So, I have a sheet per year, the sheet is days horizontal & weeks vertical.
Lets say I ride MTB Sunday and road bike Tuesday & Thursday.
How do I get a weekly sum of the two different bikes. The colour coding of the cell background works well (in Excel, anyway), and it gives an instant visualisation of what bikes I’ve ridden.
Also, I have a tab per year going back to 1995 I think, I do not want o have to change everything as it all works fine in Excel, just want it to work in Calc on Linux, It does seem to work OK on Win10/Win11 with Calc.

That’s completely wrong — always.

Even worse.

At some time, you decided to write VBA programs in order to make Excel do these stunts.

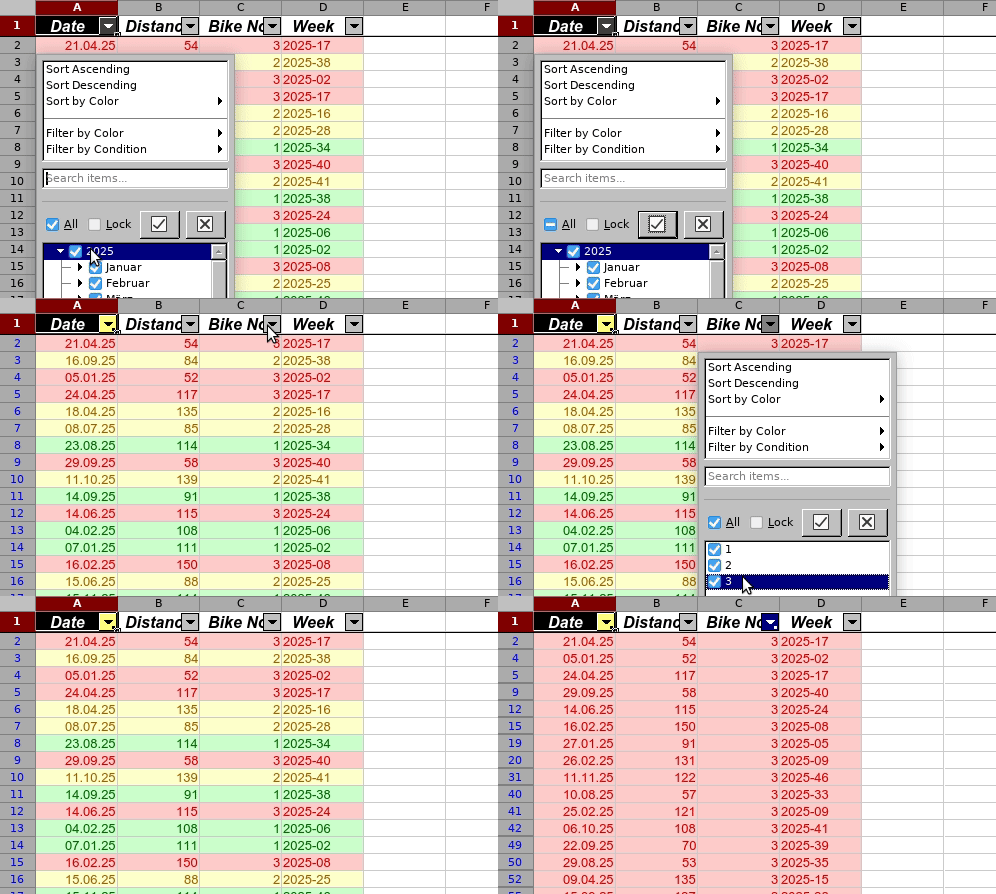
All I suggest is a flat, most simple list containing all comparable data. The software (be it Calc or Excel) can separate time intervals and categories (bikes) easily. Entering a bike number is easier than picking the bike color from a toolbar. I forgot to add the auto-filter buttons, which allows picking any combination of bikes, years, months, weeks without navigating across sheets.

However, it would be better if you decide to change everything. Indeed, the solution that @Villeroy offers is much more effective than a set of macros for - let’s face it - poorly organized data.
I’m sure that your programming skills are enough to very quickly create a macro that will go through all the sheets of your e-book from 1995 to the current year, collect data from each sheet, convert days-weeks-sheet name into real dates and create a new spreadsheet with one long list of data for the entire time of your training. It will not be difficult, but will give amazing results, just take our word for it.

A single sheet of a modern spreadsheet is enough to collect data on your training for ~2800 years.

I did that already.
https://forum.openoffice.org/en/forum/viewtopic.php?t=93099
https://forum.openoffice.org/en/forum/viewtopic.php?f=21&t=77069

Simple formulas can generate the dates.

The whole point is I wanted my sporting activities to be viewable on a “calendar” basis.
It does this nicely IMHO, a year per tab/sheet. (Not only cycling, but squash, taekwondo & Pilates).
I have a week start date cell, 14 cells for AM/PM of each day, then several different SUM cells,
and then 52 or so rows for the year.
I also wanted to track how many miles I’d done, per bike as well as overall, per week etc.
If I have to have a cell with a bike identifier, that’s an extra cell, whereas colour coding the cell for the bike does it without an extra cell.
I may well be missing out on a lot of the power of Excel (or Calc), but so far Excel does everything I need it to in what is to me a easily understandable format.
I just wanted to do in Libre-Calc all I do in Excel.

Open my sample.
Click any cell in the source table.
Call menu:Data>AutoFilter

  • Now you can view subsets by year, month, day, week
  • You can view the top 10 or bottom 10 distances.
  • You can view by bike.
  • You can combine any of the above.
  • You can add more pivot tables making all of the above comparable to each other. Try this with formulas referencing different sheets.

You don’t even need to bother where to store new records. Just define the list as a database range (Data>Define…) and apply a sort order (for instance latest on top).
From now on, insert new cells anywhere in the list, enter data, call Data>Refresh and everything will be in place.