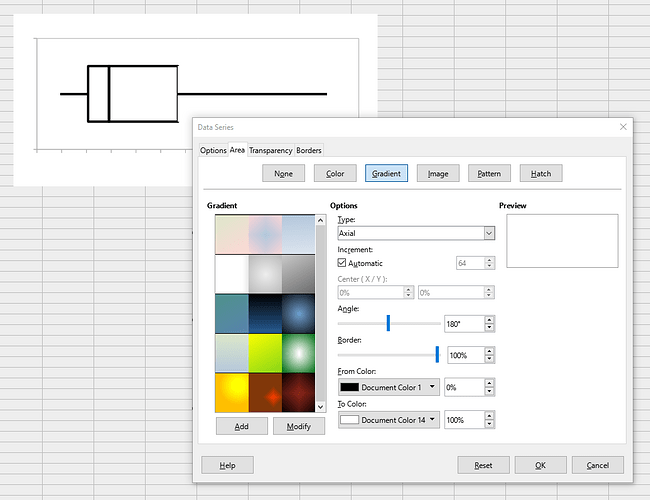
I needed a box plot for my calc sheet, and I ended up messing with a bar graph.
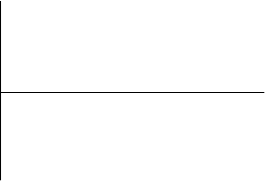
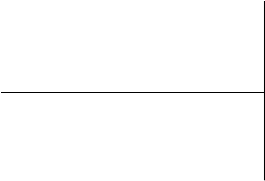
My only question is would there be a way to fix the overlap happening around the third quartile mark? (Shown below)
The way I styled the bar graph is that the IQR boxes use a border and no fill, while the “whiskers” use an axial gradient. (Shown Above)
This overlapping is coming from the right whisker, and with that, there were only three ways I could think of maybe fixing this. 1st, making the second color of the gradient (the white) transparent. 2nd, adding a border to the whisker but only for the left side. Or 3rd, bringing the IQR box to the front so that it’s shown on top.
I’m asking for help because I can’t find out how to do any of those, so help or additional suggestions are greatly appreciated!


