It’s my first time in this forum, so i didn’t know what to expect.
So, I just waited for responses to see what you need:) Pitty I can’t subscribe to these questions.
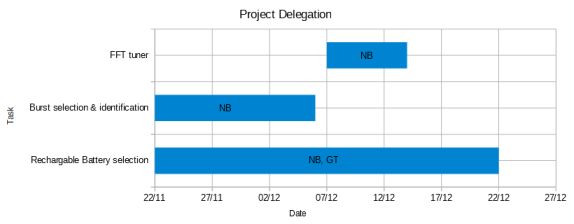
I have created a simple Gantt chart in libreoffice using the advice in the web.
You can download the sample of what I’m talking about, Mobisol.ods, from:
The advice I got from the web is the same for all spreadsheet calcs, from openoffice, to excell and to libreoffice:
Basically I start with a stacked bar graph, where I set the fill of the bottom stack to “none”. I also have to set the y-axis to date format.
I’m not asking for anything complicated like hierarchical plots. I just want to assign ownership to each task (bar). I was thinking of 2 possible ways, feel free to suggest better ones:
- Label each bar (data point) with its owner.
- Use a secondary x-axis where categories (owners) are different from primary x-axis
TIA,
Nikos


