Graph in calc with star basic

Hello,
I have problem with this code:
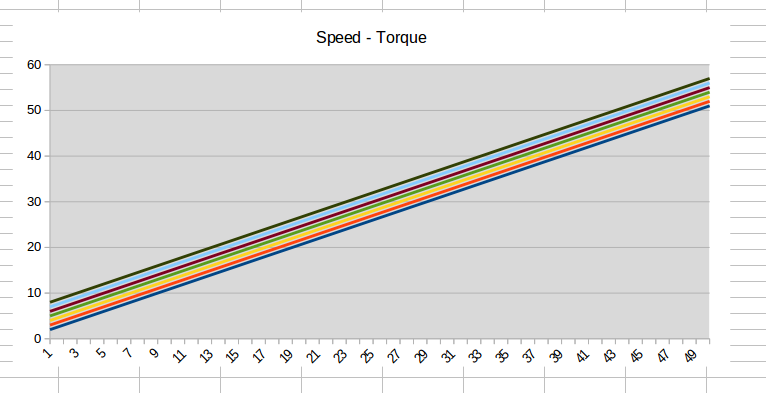
the graph “Example_01” is created,
but I don’t see it

Can You help me?

Thank you

L.O. 5.2.0.4
S.O. Windows7

  Sub CreateCalcWithSimpleChart

Dim oSheet 'Sheet containing the chart
Dim oRect 'How big is the chart
Dim oCharts 'Charts in the sheet
Dim oChart 'Created chart
Dim oAddress 'Address of data to plot
Dim sName$ 'Chart name
Dim oChartDoc 'Embedded chart object
Dim oTitle 'Chart title object
Dim oDiagram 'Inserted diagram (data).
Dim sDataRng$ 'Where is the data
Dim oCalcDoc

oCalcDoc = CreateCalcForChart()
	
	sName = "Example_01"
	sDataRng = "W71:AD120"
	oSheets	= ThisComponent.getSheets()
	oSheet	= oSheets.getbyIndex(2)
	oAddress = oSheet.getCellRangeByName( sDataRng ).getRangeAddress()
	oCharts = oSheet.getCharts()

If NOT oCharts.hasByName(sName) Then
	oRect = createObject("com.sun.star.awt.Rectangle")
	oRect.X = 10000
	oRect.Y = 10000
	oRect.width = 200000
	oRect.Height= 100000
	' The rectangle identifies the dimensions in 1/100 mm.
	' The address is the location of the data.
	' True indicates that column headings should be used.
	' False indicates that Row headings should not be used.
	oCharts.addNewByName(sName, oRect, Array(oAddress), False, True)
End If

oChart = oCharts.getByName( sName )
oChart.setRanges(Array(oAddress))
oChartDoc = oChart.getEmbeddedObject()
'oChartDoc.attachData(oAddress)
oTitle = oChartDoc.getTitle()
oTitle.String = "Speed - Torque"

' Create a diagram.
oDiagram = oChartDoc.createInstance( "com.sun.star.chart.LineDiagram" )
oChartDoc.setDiagram( oDiagram )
oDiagram = oChartDoc.getDiagram()
'	oDiagram.DataCaption = com.sun.star.chart.ChartDataCaption.VALUE
oDiagram.DataRowSource = com.sun.star.chart.ChartDataRowSource.COLUMNS

end sub

@Fede1 Question edited for code clarity.

Have tried your the code which works. The resulting graph was extremely large so for display purposes, reduced size by 90%:

The code indicates it to appear on the third sheet and get the necessary data from there.

Make sure data placement and sheet used are correct.

Ran this using LO v5.4.1.2 on Mint 18.2

Thank you Mark,
Can you help me to understand how to insert the legend?

Mark???

Add line = oChartDoc.HasLegend = 1 after oTitle.String = "Speed - Torque"

Sorry @Ratslinger.
Thank you

There is something that I don’t undestand…
the variable “sdatarng” contains the y-variables,
if i would like to define the x-axis, instead?

@Fede1 Sorry for delayed response. Sleep caught up with me. First, let me explain I am no expert with charts. I get by. My interest was to create charts in LO Base (which I did after about a two year on/off relation - see this post). Most of how I got there was from documentation found here which may also assist you. Continued…

Now as to your question, I believe the way data is presented is dependent upon how it is arranged in columns vs rows. This may be one solution. Another is to simply flip the x-y axis in the macro:

oFirstDiagram = oChartDoc.getFirstDiagram()
oCoordinateSystems = oFirstDiagram.getCoordinateSystems()
oXCoordinateSystem = oCoordinateSystems(0)
oXCoordinateSystem.SwapXAndYAxis = 1

Just place at very end of your sub. Hopefully this is what is wanted.

A question,
I would like to create a graph in “sheet 1” with data that are in “sheet 2”…
Is it possible?

Thank you for all!

@Fede1 Data can come from any sheet. This is done when setting the data range which specifies not only the cells where the data resides but the sheet. Please see LO docs (click here) Chapter 3.

Questions are always welcome. However, the forum is set up for Q & A. Ask a question and get an answer for that question. If you have further questions, they should be asked as new questions.