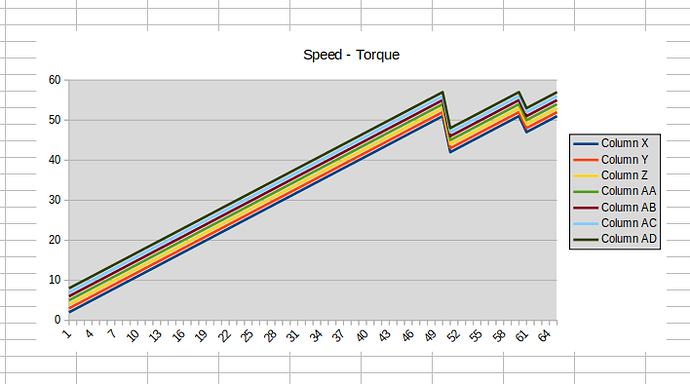
Based on what I found here I can generate a graph of one range of data in a spreadsheet using the call:
oCharts.addNewByName(sName, oRect, Array(oAddress), False, True) where oAddress is the return of oRange.getRangeAddress().
The definition of the parameter I called oAddress is
sequence< com::sun: :table::CellRangeAddress >
To graph multiple ranges of data I tried passing the data as an array of RangeAddresses and also as an array of arrays with a single rangeAddress in the secondary arrays. Both crashed calc forcing it to reload itself.
Undoubtedly part of my problem is that I don’t understnd how LO/OO uses the term ‘sequence’ nor what the rules are for manipulating/generating them.
An explanation or reference would be helpful, lacking that if someone can explain how in basic to generate a line chart including multiple rows of data or a pointer to same I’d appreciate it.
Thanks,
Mike
Ratslinger pointed out that my wording lacked clarity. Hence the mods.Thank you

