Graph layout problem

I have a spreadsheet that I want to display as a graph. (Points and Lines)
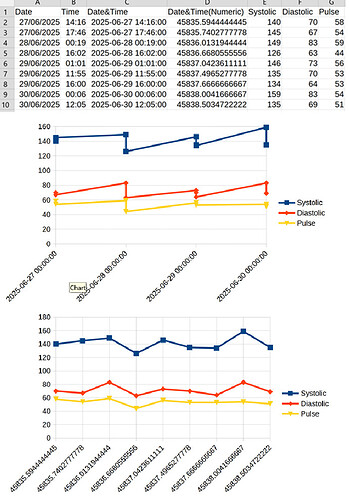
If I select columns C (Date&Time), E (Systolic), F (Diastolic) and G (Pulse).
I get the first graph below.
It appears to have ignored the time, so every reading shows at midnight.
If I select columns D (Date&Time(Numeric)), E (Systolic), F (Diastolic) and G (Pulse).
I get the second graph below.
which separates the readings, but is also useless, as the x value labels are unreadable as dates, and the x intervals are all identical rather than based on the date and time.

How can I get it to show the reading proportionally across the graph, with the dates as the x value labels?

LibreOffice version: 25.2.4.3 (X86_64) LibreOffice Community
Build: 33e196637044ead23f5c3226cde09b47731f7e27
OS: Windows 11 X86_64

Please upload a real, ODF (.ods) type sample file here.

@Zizi64
Thank you for your reply. Here is the file referred to in my original post.
Blood Pressure 2025-02.ods (37.9 KB)

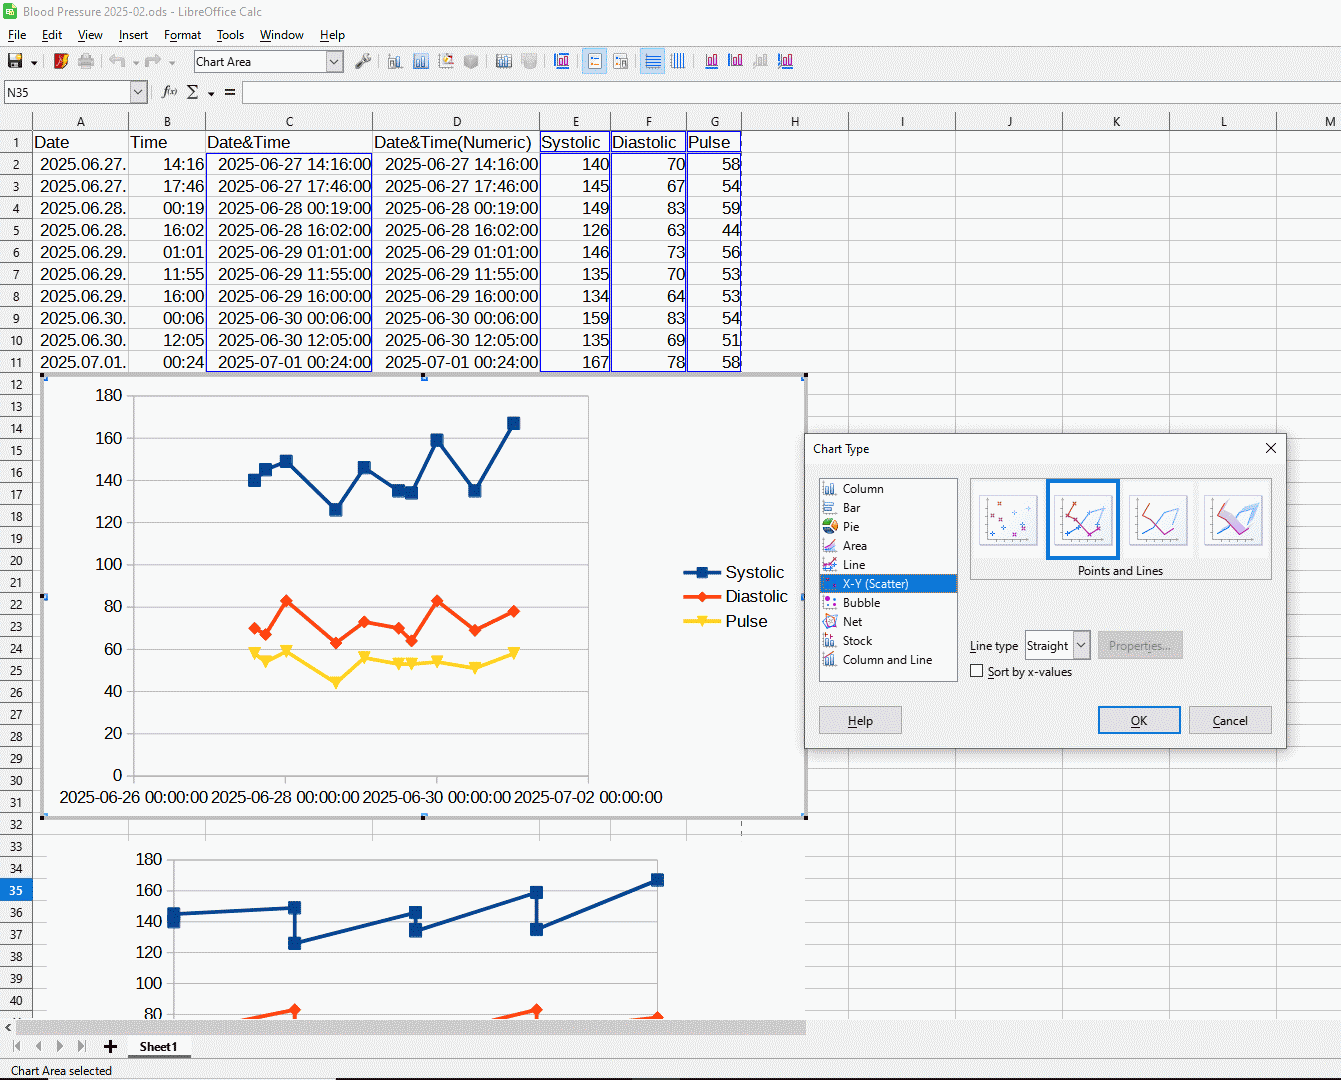
Use Scatter type graph:

@Zizi64 “Use Scatter type graph”
@Regina “You need an “XY (Scatter)” chart.”
Thank you (both of you) so much!
This was the critical point that made all the difference!
I needed lines linking the points, and had somehow failed to notice that it was possible to include lines when using the XY (Scatter) chart type.
Your replies have stopped me from going bald, as I was about to start tearing my hair out in frustration. :+1: :grinning:

Please note: I wanted to mark both of your replies as solutions, as both of them helped, but the website will only allow me to check one.
So… sorry :cry:

You need an “XY (Scatter)” chart. As your date/time is displayed as number in the table, you need to format the x-axis manually. In the x-axis properties uncheck “Source format” in tab “Numbers”, choose category “Date” and select the desired format. In addition you should check in tab “Scale” that the grid distance fits your requirements.