Graphic Y series interval as a variable

I have a huge data set. I examine this set in some interval on graphic.
But I want to give the start row and length of the graphic as a variable.

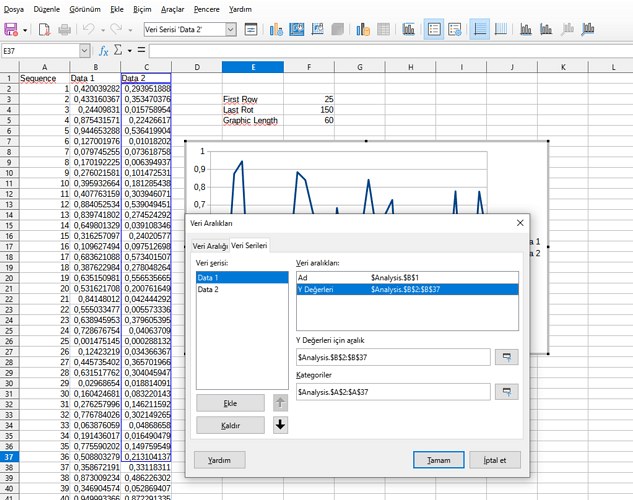
Let say the interval in the screenshot start from 2nd row and end to 37th row.
I want to start row number from value of cell F3 to F4 whatever they are.

Can i do that?

If I can write indirect value to $Analysis.$B${F3}:$B${F4}, it is ok but I don’t know right syntax.

I think the easiest way is using Advanced filter / Applying advanced filter, which allows you to use conditions in cells and send the filter data to a different range, without modifying the original data.

1 Like

Although not the answer to the question, your solution is helpful in solving my problem for now. Thank you @mariosv

Also, you can use Auto-filter, Standard Filter, or hide the rows that you don’t want to show. But those are literally manual, if there is not a pattern to set up the filters, the only one that can takes what to filter from cells is the Advanced filter.

There is an open request for enhancement.
Calc missing the ability to use a formula to specify a data range for a chart

Sorry.
Though I often answer questions on Calc, I can’t understand the subject (short version of the question) and also not its full text.

  • Are all your your “graphics” actually charts?
  • How do you “examine” your data set?
  • How to understand the line starting with “If I can write indirect …”

The image seems to show a chart related dialog (elements described in Turkish?).
Do you want to get the result for (37-2) +1 as “interval” “length” ?
Please consider this topic.
Your example document should contain a sheet showing what you have, and one showing what results you want to get (in the example case).