Hi all,
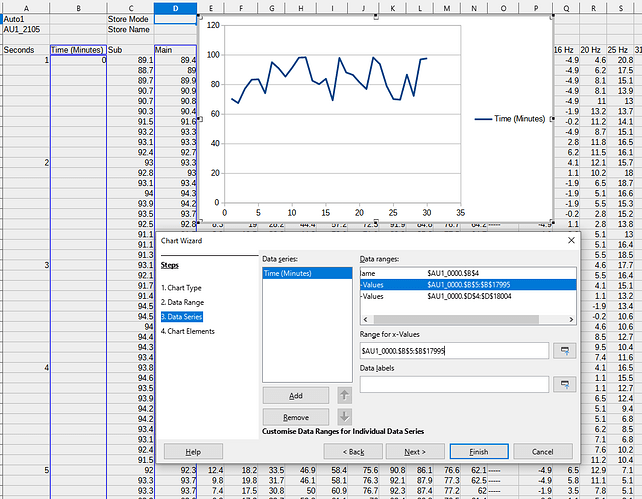
So I’m trying to plot the data from a sound level measurement, which is one reading every 100ms, for 30 mins and runs to 18000 rows. I just need to get a sensible y-axis scale in minutes. I created a “minute counter” column with an incremental number every 600 rows, but if I attempt to plot this against the fine data by selecting the two columns as data ranges, I just get one value plotted every 600 rows (first picture), rather than the detailed plot. Is there a way to achieve this? A friend did so in Excel but it’s not quite the same!
Thanks everybody!
I definitely can’t understand for what reason such a question concerning a clearly technical topic is posted and treated with lots of area misused for images of very little value, but without a .ods file containing a relevant example.
Sorry, I’m not accustomed to the practices of the forum. The original is a CSV file in a format proprietary to the sound level meter and is over 5MB and 18000 rows - I thought that an image of the relevant chart and data ranges might be easier to digest. If that is incorrect then my apologies.
Sorry, too. I’m not interested in the csv, but in an .ods actually containing the chart. That way I can work on existing data columns and everything …
I also don’t think this is just “practice of the forum”. It’s more about “considering the other side”.
You may now comment on the “solution” I suggested.
Sound level measurement over time would usually have time on the X-axis and level on the Y-axis. It is conceivable to have it the other way around (time on the Y axis) but for that, summation and a histogram make more sense to me than a line chart. I may have misread your objective.
- I’m guessing that you need the time values on the X-axis (spread out horizontally).
- While the Seconds and Minutes columns with interspersed figures make sense to us humans, Calc needs actual time values for every entry in order to position the plot correctly.
Try this:
- In cell B5, enter 0:00:00.0
- In cell B6, enter 0:00:00.1
- Select both cells B5:B6.
- See the tiny square at the bottom right corner of the selection. That is the fill handle.
- Drag the fill handle down column B, all the way along your dataset.
Your chart should now update according to time values as established. You may need to adjust the axis values to achieve the desired time formatting.
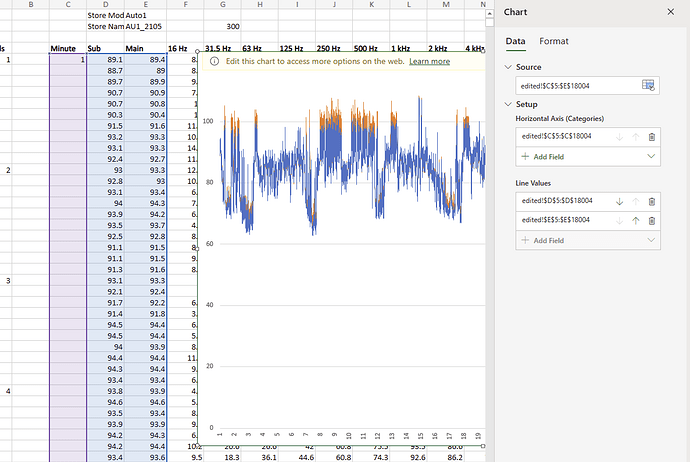
Sorry, yes of course meant time on the x-axis! But you’ve correctly identified my problem, thanks! So, if I follow your method, I will still have a huge bunch of numbers on the x-axis, and the values will be in ms not minutes though? I’m only asking because a friend showed me this method in excel, and excel was able to keep the fine data of the 100ms plot even when the x axis data only included 30 data points (below)
Also, with the 00:00:00:1 numbers, by the 18,000th row I just have 00:00:00:18000 rather than 00:30:00:0 which would be the correct time, no matter what time format I select for the cells. Is there a way to force it to count as time rather than just adding to the previous cell value?
Please look carefully, and spot the difference.
Thanks to @mikekaganski for pointing out the separator error. (Hint: the “milli” in your milliseconds implies a decimal fraction, not hexagesimal as is the case for minutes and seconds.)
Also, spacing values as desired on the axis may require X-Y chart, not a line chart. Looks like an X-Y chart is what you have, but just to make sure 
Editing the axis labeling is a bit tedious and perhaps not “intuitive” when you came from a Microsoft context. Double click the chart object to put it in edit mode, then click the actual chart to enable it, so you can select the axis (have to point perfectly on the axis when you click) and edit its properties.
This ain’t any number. What is the 4th number behind the 3rd colon?
Hours:Minutes:Seconds:XX
It might be some kind of “frame”, for instance “1” may mean 1/30th of a second which is not the same as a decimal fraction of a second.
Calc can interprete Hours:Minutes:Seconds.DecimalFraction but not Hours:Minutes:Seconds:XX, therefore your “times” are just text values with digits and colons.
The following formula converts the text into a valid time:
=TIMEVALUE(LEFT(A1;8))+VALUE(REGEX(A1;"\d+$"))/86400/30 (8 characters for hours, minutes and seconds, 1/30th of a second in the trailing digits)
Ah stupid mistake on my part. But I am an idiot so it’s to be expected.
Most of us make stupid mistakes at times.
The idiot is he who refuses to learn from mistakes. You do not appear to be him.
So, final question: is there a time format that allows me to display the minutes as simple integers, 1, 2, 3 rather than “01:00”, “02:00” etc. which are easily confused for times of day? I think that was the aim of my colleague when he presented me his excel method, and it makes everything much clearer (as per his excel chart). Thanks!
Use [m] - either in source cells, using “source format” in the axis (but then it would be not convenient), or in the axis configuration.
Amazing, thanks. Sorted perfectly.
Having the numeric time values, =MINUTE(A1) returns the integer number 45 from 23:45:59 in A1. Number format MM displays the same 45 but without calculating any number of minutes.
However, you may want to get the rounded minutes (23:45:59 – > 46). That would be =MOD(ROUND(A1*24*60);60).
A realistic example uploaded by the questioner would have saved me at least 20 min.
disask94001simpleChartCase.ods (397.5 KB)
I can’t see a reason to insist on column A for the X-values. A chart is a chart, isn’t it? And somebody copy/pasting the chart elsewhere and then reading out the data tables should …
[Coming back after an unavoidable break.]
After some serious mistakes, I feel responsible to present what can be done, imo.
disask94001trickyChartFakingUsedUnit.ods (418.1 KB)
Working with a seconf (fake) series I could introduce a second x-axis. Both the x-axes are then equally positioned and manually scaled to align their minimums, maximums and (major) grid steps as appropriate for the display. Then the second axis gets its number format (and …) as wanted for the display, while the first x-axis is factually made invisible by assigning the number format code "" (empty string) to it.
The more than 3000 year old idea to use a sexagesimal subdivision (for the angle of the equilateral triangle originally) and later … whatever still creates a mess in real life and in spreadsheets.
Many years ago I did such tricky charts with a touch of fun now and then. This time was the last time.
This example shows the same problem I ran into - the chart is only taking a data point every time one appears in column C not every data point in column D, so the chart loses any useful waveform data.
There I fell into a trap again, which I actually knew long ago.
Seems I didn’t even thoroughly enough study the other posts.
Now I have wasted your time. Please accept my apologies.
In fact I would lik to delete what I wrongly posted as a solution.


