Histogram in chart wizard

Why is there not a histogram option in the chart wizard? This is one of the most common kinds of chart used in data analysis. The best I have found is some long winded approach using the FREQUENCY function. However, often one just wants to quickly check the distribution of some data (to see if it is normal for instance).

There seems a good opportunity to steal a march on a well known competitor here. The histogram options in MS Excel are pretty inflexible. In particular I have not found a way to set specific bin ranges, which one would often like to do with continuous data. The Analysis Toolpak has gaps between columns, which is not appropriate for continuous data.

It would be great to have something available in LibreOffice which was mouse clicks away, but also post-create configurable. That is, it would recognise whether the data was discrete or continuous, automatically choose appropriate bins, but then give opportunity to specify them after.

I teach a university introduction to stats module. It would be great to be able to use LibreOffice Calc, but it is without a histogram wizard, so I have to use Excel (and it’s substandard histogram wizard). I like to promote open source software, and this would be an ideal opportunity (and I would not have to boot into a sub-standard operating system :wink:

Histogramming is pretty easy with hands:

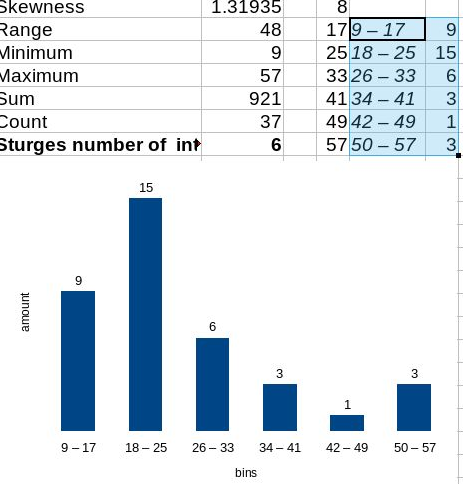
Statistics on data shows Min 9 (cell G13) and Max 57 (G14) of 37 data points or ‘counts’ (G16) in column C

I implement Sturges’ rule for determining bins, i. e. number of intervals G17 with =1+TRUNC(LOG(G16,2)) and generate column of bins with =$G$13+TRUNC((ROW()-11)*($G$14-$G$13)/$G$17) filled with I11=8 (!NB MIN-1 and is skipped) 17 25 33 41 49 57

For data labeling I fill next column with =TEXTJOIN($H$1,1,I11+1,I12) where H1 is a cell with " – " separator to make the whole cell look like 9 – 17 
 50 – 57.

Finally F 12:17 cells I fill with array function =FREQUENCY($C$1:$C$37,$I$12:$I$17)
image description

Bar chart, but not histogram.

  • A histogram is used for continuous data. Bars should touch to reflect this.
  • Bins may be different size. Width of bar should reflect bin size.
  • Heigth of bar signifies frequency, i.e. (roughly) count/binsize. Not simply the count.

Your first bin is larger than the rest, but I suspect this is by accident. The width looks equal on all bars.

1 Like

Thank you for pointing out the difference,

Indeed 17-9=8, due to trunc used in formula

This in particular is unfortunately why I have to also use MS Excel :sob:

Have you checked to see if this extension, Advance Office Chart » Extensions , works for you?

It says on the page “it is possible to plot Venn diagrams (upto 4 way, get the elements of different sets), histogram (flexible), and boxplot charts and save them in png or SVG format” (my bolding).

nice thing indeed
functionality is not what one would require from the chart but definitely it fills some gap
(LibreOffice developers: a shameful gap)

@Ash733 really? come on 
 :wink:

1 Like

The trouble with this extension, other than not having all the charts I need, is the charts aren’t editable. You generate the chart, and effectively copy and paste an image of it into your workbook.

Trust me, I don’t say that lightly. I want to be rid of it.

This is just kinda “workaround” and does the job as a visualisation of fixed data, and oftentimes it’s enough
Conceptually creating a decent tool for histogram plotting is not a rocket science, and it is indeed superstrange that the thing has not been (hope: so far) implemented into LO :frowning:

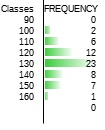
to get something alike one can also use FREQUENCY function and DATABAR conditional formatting on the results of it
the outcome would look like this:
hist

The short answer is because there hasn’t been a developer able or willing to implement it. If you have programming experience and have the time and inclination to tackle it the rest of the community will shower you in bug reports :wink: