I have a calc sheet with a column like this:
 A
 B
 B
 B
 A
 C
and I’d like to create a diagram which displays
 A 2
 B 3
 C 1
i.e. the distinct texts and how often each text appears.
I’m using LibreOffice 4.3

I have a calc sheet with a column like this:
A
B
B
B
A
C
and I’d like to create a diagram which displays
A 2
B 3
C 1
i.e. the distinct texts and how often each text appears.
I’m using LibreOffice 4.3
Try the FREQUENCY Function. The help shows an example that can be adlusted to your problem.
My help doesn’t show this; in fact, it doesn’t contain a “FREQUENCY” function. Part of the problem is that I’m using a German version.
Could be Verteilung or Häufigkeit. I’m German but work only with english versions. Es ist HÄUFIGKEIT. Im deutschen forum gefunden.
Have your data in column A (A1:A6 in the example).
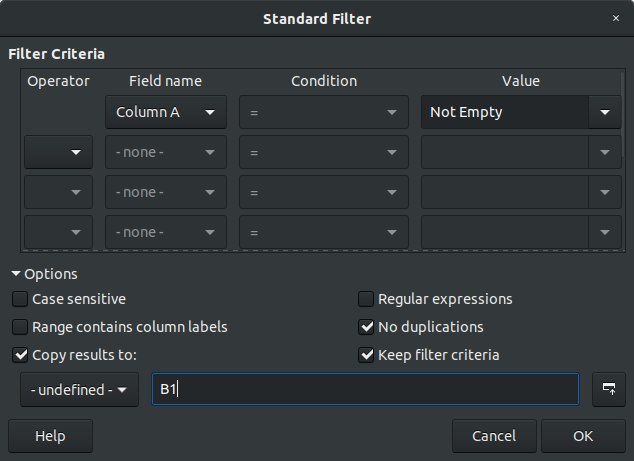
Create a Standard Filter (Menu Data → More Filters → Standard Filter…)
In the first row:
=
Reveal the “Options” below.
Select “No duplicates”
Select “Copy result to:” and enter B1 into the text field.
The result should look like this:

Click “OK”. You should now see “A B C” in column B1:B3
In cell C1, enter this formula: =COUNTIF(A$1:A$6;B1)
That gives you the count of A in column A.
Copy this cell once for every value in column B (three times in the example).
Lastly, you can create a histogram using the cells in B and C. Click Menu Insert → Chart… and you’re done: