How can I add a symbol in my graph for specific values (e.g. minimum or maximum)?

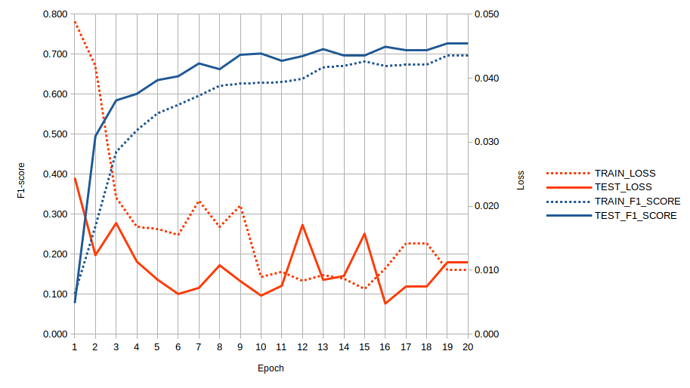
I have created a graph for displaying the results of a deep learning model I have trained (see image below). I would like to add a symbol (e.g. a small cross or square) at the epoch with the highest values for the F1-scores, and the lowest values for the losses. For example, in the case of the TEST_LOSS, I would like to add a small symbol on top of the continuous red line at epoch 16. Is this possible in LibreOffice Calc?

Thanks a lot in advance!

It would be much simpler to provide a tested solution having a sample sheet. My idea, I’d like to test: Since all Min and Max values are determinable, add 2 additional “data series”, which consist of one data point each only and assign a symbol to that “1-point data series” (I’m not willing to try to rebuild/fake your chart from scratch).

Ah, thanks, that makes sense! I already have the max. and min. values (and also their associated epochs), so that would probably work. I was just wondering if there is a direct solution for it in LibreOffice calc.