How can I create a stacked bar/column/area chart?

Hello - I have a basic question I just can’t find any answer for in the help or by googling. I want to create a stacked chart. I see different chart sub-types mentioned in help, like stacked and percent. Yet I can’t find anywhere to choose these options.

So, how do I create (any) stacked chart?

Hello

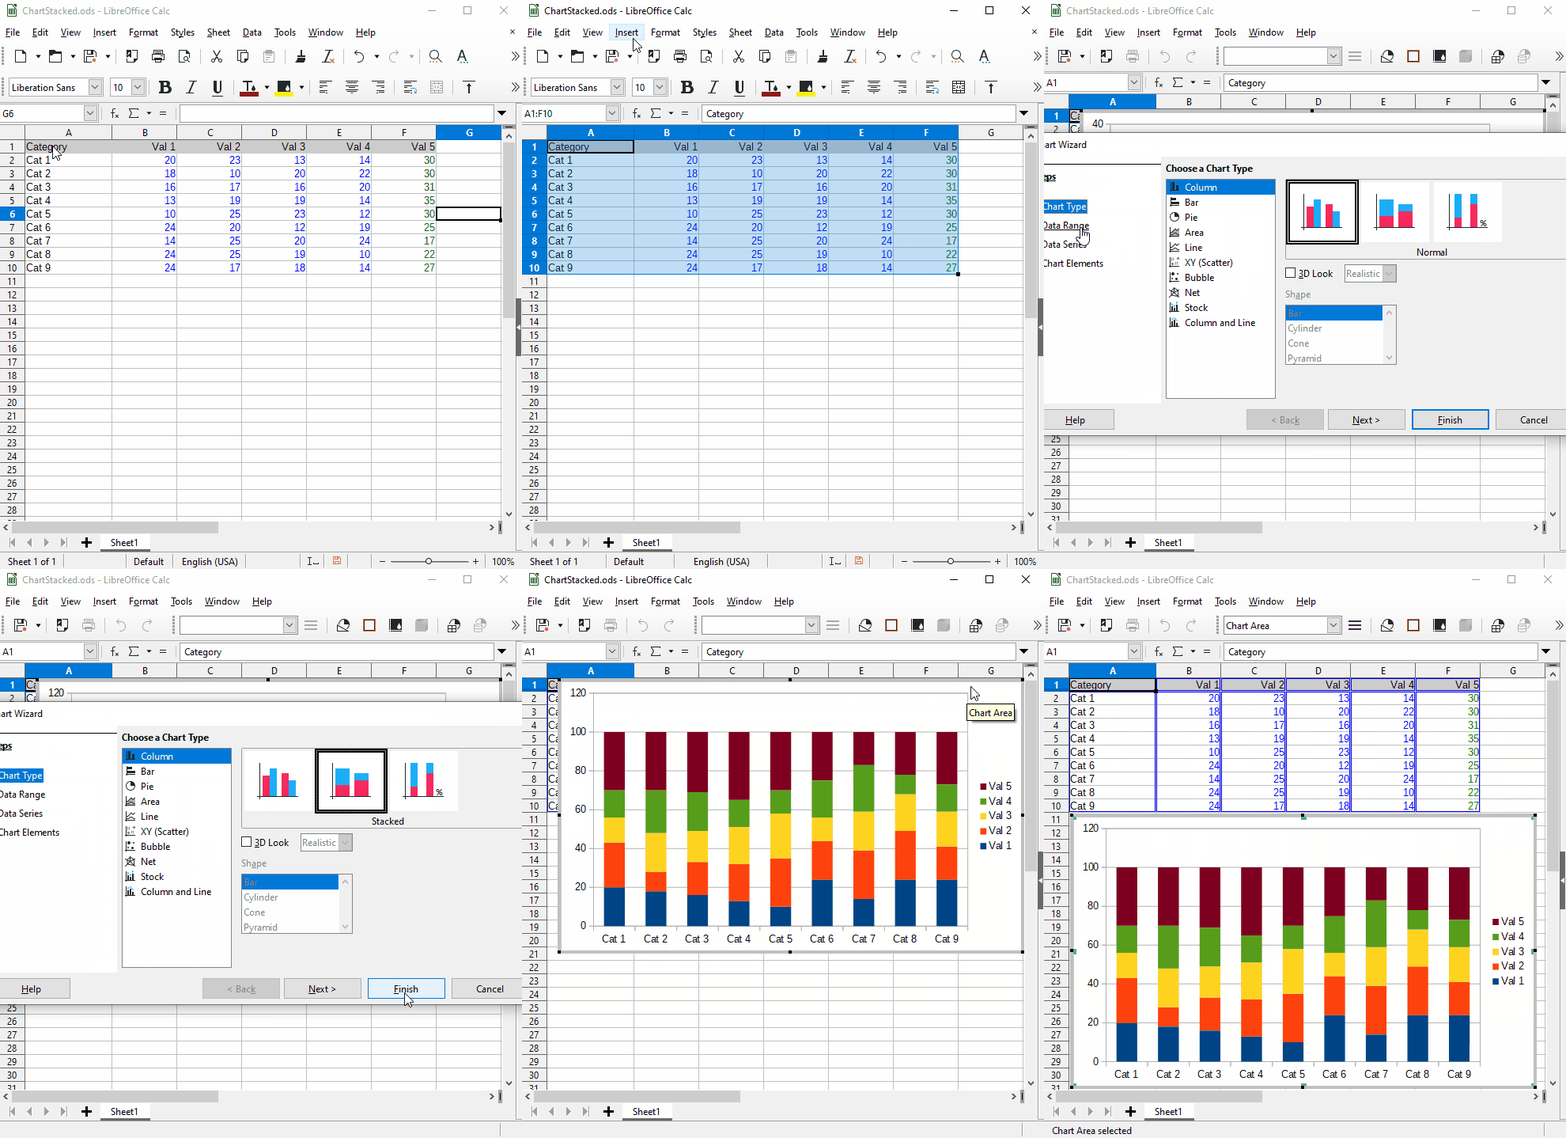
  • Select the data range
  • Go to Insert -> Chart
  • Select Chart Type Column
  • Select Stacked (which is the second icon on top of the right pane) – or – Select Stacked Percent (which is the third icon)
  • Click button Finish

image description

Tested using LibreOffice:

Version: 6.4.3.2; Build ID: 747b5d0ebf89f41c860ec2a39efd7cb15b54f2d8
CPU threads: 8; OS: Linux 4.12; UI render: default; VCL: kf5; 
Locale: en-US (en_US.UTF-8); UI-Language: en-US; Calc: threaded

Hope that helps.

If the answer helped to solve your problem, please click the check mark (:heavy_check_mark:) next to the answer.

Thanks. It looks like I have encountered a bug. I don’t see those icons in the right pane - it’s just empty.

Please mention your operating system and your LibreOffice version - I don’t believe you got a bug, but you may face a corrupted LibreOffice user profile. Check, if you have Help -> Restart in Safe Mode... and if yes, call that function an check once more. If, while running in Safe Mode the functionality is available, you probably face a user profile corruption, which could have really very strange side effects,

i just had the same issue. trying again in safe mode fixed the problem (Ubuntu 2020.04, libreoffice 6.4.5.2)