How do you create a chart with two different y-axes

I would like to create a chart with two or more lines with each line (or set of lines) u sing different y-axes.For example, one set of data points (for a line) showing dollars, and another set of data points using percent (%). Is this possible? If not, can I suggest that this be included as a feature in some future release?

In the money and percent case, it is a good way of comparing the cost of a decision against the change it represents.

thanks

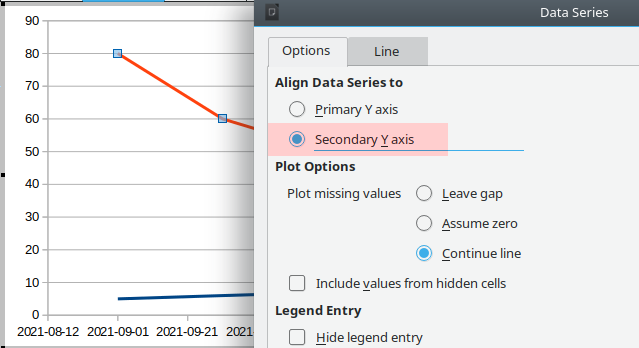
Edit the chart, select the percent data serie, secondary click and choose Format Data Series… (or choose menu Format - Format Selection…) and select Align Data Series to Secondary Y axis, OK.
secondary y axis

More LibreOffice Help on Charts and Axes.

Im doing this with one data being in order of millions and the other data in terms of share or percent. The lines overlap, making reading difficult, how do you add a gap between the lines while still preserving the data?

Lower the minimun value for the scale of the millions’ Y axis.
Or augment the maximum.

How do I lower the scale while preserving the values I have?

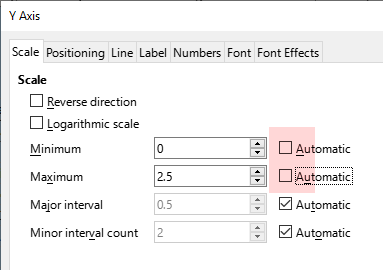
Edit the chart (context menu on the chart - Edit), edit the Y Axis (context menu on the Y axis - Edit), uncheck Minimum and Maximum, and enter your values.

imagen