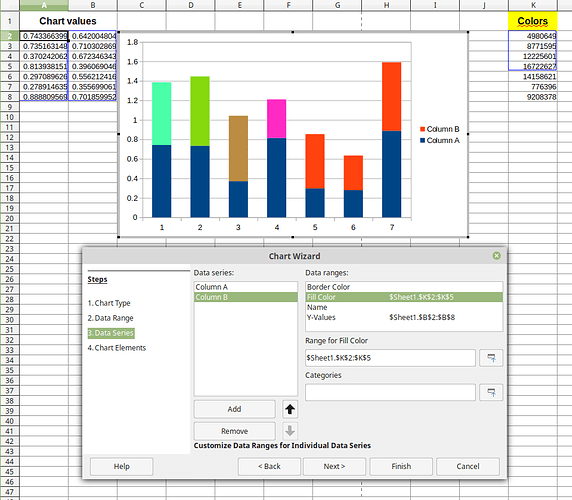
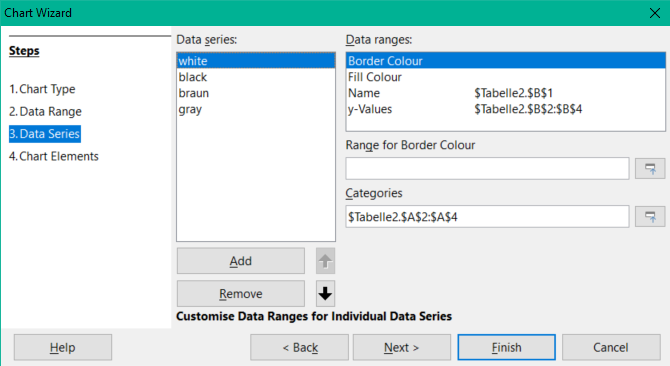
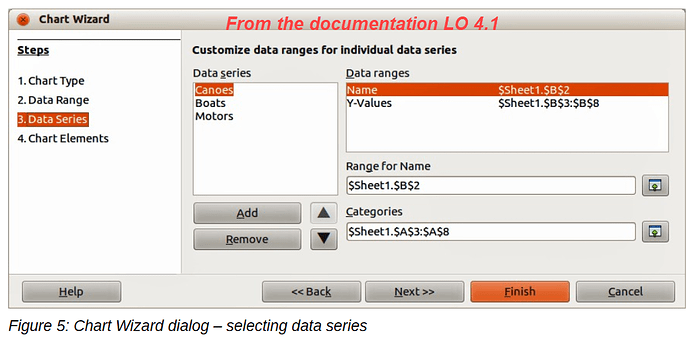
In the Chart Wizard, we can enter ranges for color and fill for each data series. The problem is that I don’t know what to put in the cells.
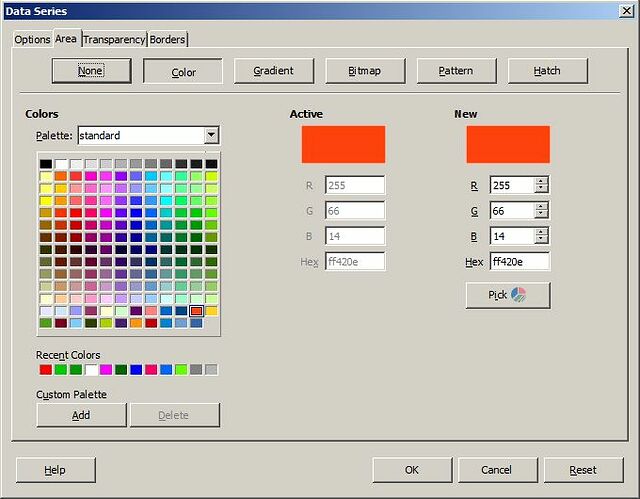
Presumably the cells could contain numeric codes for colors. That way, each data point could have its own color. But what codes are used? How do I find/derive them?
Also, I have read about property mapping and it sounds like it could be used. In fact, it looks like there used to be a button for property mapping. However, there is such button now. If I want to use property mapping, what do I do? Can anyone share examples?


