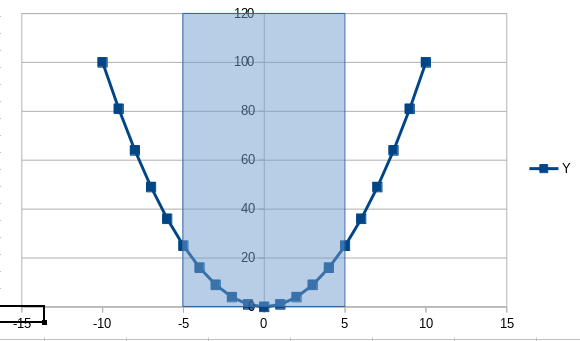
Is there any way to add colored ranges to a scatter chart, similar to the axvspan in matplotlib?
Hello,
no - there is no way to do that by means of given functionality. The only way (I’m aware of) is more or less a poor workaround overlaying the chart with rectangle colored shapes, setting transparency and grouping the images.

So these colored shapes are part of the spreadsheet and not part of the chart? So they won’t move around if you move the chart around?
So they won’t move around if you move the chart around
That’s why I wrote “… and grouping the images” If you group the chart and the overlaying shape, they are one single object and move together. The drawback is: Whenever you need to modify the chart you need to Enter group
With a simple trick should not be difficult, doing two charts with the same size and the line chart forward with area transparency at 100%, or with the same trick using the cells on the background to get the same effect, perhaps in this case with a conditional format…

