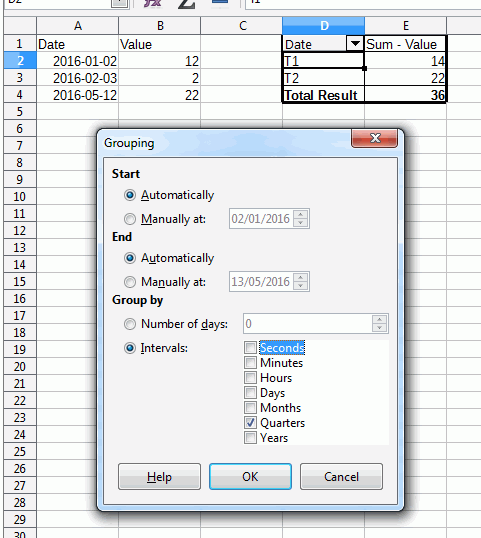
I have data like this:
Date            Value
2016-01-02         12
2016-02-03          2
2016-05-12         22
It’s a big dataset.
What I want as an end result is a chart of sum(value) per quarter.
I made a new column that took the date string, converted it to an internal date, and then formatted that column like YYYYQ which results in displayed values like 2016Q1 and 2016Q2. However when I do a pivot table from that, it uses the underlying value (the specific date) not the formatted value, so it fails to group by quarter.
I could solve this problem many ways, here’s some ideas (none of which I can find a way to do!)
- if there was a
DATE_FORMAT(<CELLREF>, <FORMATSTRING>)function that resulted in a text string, that would work. - if there was a
FORMATTED_VALUE(<CELLREF>)function, that would also work. - if there was a
 Use formatted value option in pivot table, that would work.
Can anyone help?
Currently my work around is to copy the column into a text file and then paste it back over the top as text values!

