Example is how many visitors are onsite at any one time based on entry and exit times?
Columns are customer, Date, time in, time out. For each customer visit I want to know how many other customers were on site at the same time.

Example is how many visitors are onsite at any one time based on entry and exit times?
Columns are customer, Date, time in, time out. For each customer visit I want to know how many other customers were on site at the same time.
For each customer visit I want to know how many other customers were on site at the same time
This is ambiguous. During a visit of a specific customer X, the number of other customers is a function of the time (some other customers leave during the visit time of customer X and some others come in). So you could ask “How many other customers could customer X have met during his visit?” or “What is the maximum of other users on site during visit of customer X?”
…moreover, some users may have logged out and logged back in several times. Do you want to consider them as separate customer?
=SUMPRODUCT(<column Date> =B2;<column time in> <=D2;<column time out> >=C2)-SUMPRODUCT(<column customer>=A2;<column Date> =B2;<column time in> >=C2;<column time out><=D2)
Good points. These are actual people entering a physical site. If one person entered and exited during that period I don’t care.
At the end of the day I guess I am interested in 1) the maximum number of people that are ever on site together 2) the average number of people that are on site together.
After that trying to figure out how the time spent on-site relates to the number of people on site (ie does the time they spend increase or decrease depending on how many others are on site).
You can easily find the maximum and average, perhaps you can even build a diagram how these values change every hour during the day, week, months. But - this is just my opinion! - an attempt to evaluate “depending on how many others are on site” is doomed to failure. This indicator can be influenced by the start of a football match, the new HBO series, the weather outside - much more important reasons.
The actual application is to determine how the number of people/vehicles dumping at a landfill influences how long it takes to complete the task. With more people on site there is crowding at the bins so things slow down. It would be helpful to know what the optimal number of vehicles at one time is to get the best throughput.
For clarity:
I have data regarding the entry and exit from a landfill site. I know the time when a client passed over the inbound scales to the site and the time when they hit the outbound scales and left. While in the site they take a certain amount of time to offload their vehicles and some time spent waiting for the outbound scales.
I would like to know the impact of volume of clients on site on the time to offload. Presumably more people trying to dump at one time will slow the process as there are a limited number of dumping bins.
I think it would be helpful to know: 1) how many people on average are on site dumping at one time 2) the maximum number of people ever on site dumping at same time 3) average time increase as dumpers increases.
Yes, this makes your task much clearer. You may also want an additional analysis “10 customers, when they appear on the site, the average latency of all customers always increases - these turtles detain everyone, they should have a personal check-in schedule”
any thoughts on the solution? I am fairly new to array functions.
Yes, please wait - I am just finishing the description of the process, I will publish soon.
Let’s do it together
So, judging by the description of the data that you gave in your question, the table contains four columns.
To make the formulas that we are going to create easy to read and understand, we will assign meaningful names to the data ranges (As we work on the table, this list will be replenished)
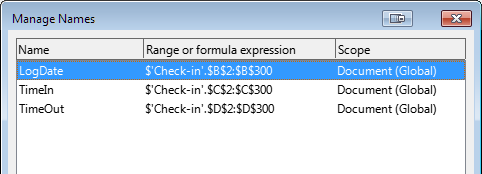
Since one of the tasks we are going to solve relates to the time spent by the object on the site, let’s calculate this duration time for each visit. This can be done using formulas in the helper column, but we’ll do it a little differently. Let’s just create another name (i.e. DurationTime), but its value will not be a range of cells, but a simple formula TimeOut-TimeIn.
As we know, analysis is the process of breaking a complex topic or substance into smaller parts in order to gain a better understanding of it. Let’s break the entire protocol “time-in and time-out” into small parts.
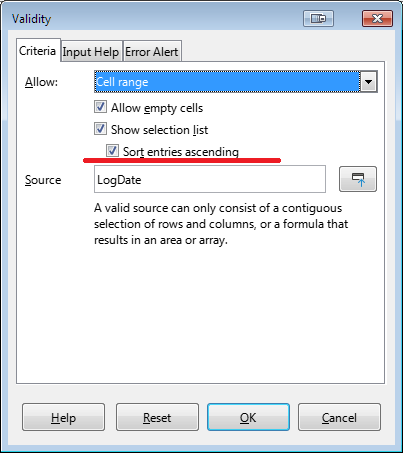
The first step of detailing is to take only one day’s data. Step back a little from the source data table, for example, into cell H1, make an explanatory signature, and in cell I1 create a drop-down list to select one date from the dates available in the Date column (named range LogDate).
Many formulas will use the value from this cell. So that the formula does not contain an incomprehensible 'Check-in'. $I$1, we will assign our name to this cell, something simple, for example aDate
Now let’s split the data into even smaller pieces. Let’s break 24 hours of one day into many chunks of the same length, small enough to see the details throughout the day, and at the same time large enough to fit these timestamp values into one line. Now the Calc table contains 1024 columns, that is, making a segment less than one and a half minutes is dangerous - there is not enough space. Let’s start with a 5 minute segment, later you can change it as you wish. Move even further to the right, in cell X1 write Delta time so as not to forget what it is, and in cell Y1 write 00:05. I have named this cell ChartStep
(I can’t even imagine how long it takes to offload their vehicles. I hope this is not Formula-1, accuracy to the seconds is not needed)
Now in AA1, enter 0 (“midnight”), in AB1 the formula =AA1+ChartStep, format the range Y1:AB1 as hours-minutes (so that 00 seconds does not hurt your eyes). Stretch the formula to the right until next midnight. Let’s name the range $AA$1:$LC$1 as ChartPoint
Now let’s enter in AA2 the formula =N(AND(LogDate=aDate;TimeIn<=ChartPoint;TimeOut>=ChartPoint)). The meaning of the formula is simple. The AND() function will return TRUE if the date in this line (column B) is the same as the one selected from the drop-down list, and the car was on the landfill site at that moment in time. And the function N() will convert the result of the function AND() into 0 or 1.
Copy cell AA2 Ctrl+C, press Ctrl+Shift+End to select the whole range until next midnight and until the last data row, paste Ctrl+V. In such a simple way, we will get a detailed map of one working day, where the value of 1 indicates the presence of a specific machine at the landfill at a specific time.
You can colorize this range using conditional formatting and get something similar to a Gantt chart. But it seems to me that this is useless - you can hardly see (and understand) this entire range in one go. Therefore, let’s move on to the next step, to the synthesis, collect the small details into the big picture. For this stage, we will create an additional sheet in our spreadsheet, let’s call it (surprise!) Synthesis.
Here, using formulas, collect the summary information from the original data and the “map”. The sum for each column of the map will give you the number of cars that were on the range at that time. AverageIf() helps to select the desired data from the named range DurationTime (You must use an array formula for the calculation to be correct).
Based on this summary table, build a chart, customize it as desired and move it to the sheet with the original data, below the drop-down list with dates.
Now the hardest part - choose different dates and try to find a dependency.
Perhaps with special tools you can get the same result faster and easier, but you asked about Calc …
Example file - DateTimeStat.ods
Wow - fantastic answer!! I will try it today, but I understand the logic and think it should do the trick. I really appreciate the time and detail in your answer. Thanks.
BTW - any free tools that you would recommend that might make the job easier/faster that doesn’t require a PHD?
Basically, as far as I know about the work of analysts, the main free tool for them is their head … and some knowledge of mathematics. Not even “mathematics”, as a science, but ordinary arithmetic (addition, subtraction, in the most difficult case - raising to a power). And understanding of the principles. And the usual everyday logic. And a little fantasy, imagination. For a start, this is quite enough. Then comes the mastering of functions from Category Statistical - they allow you to skip some of the intermediate calculations … But this is already PHD
Interesting problem with my data - the date and time columns are have full date/time content (ie 2021-01-01 10:12:46) making the selection of date field (ie aDate) a combination of date and time values. I have tried to create a new helper column with just the date using Datevalue of the date column but get an Err:502 (ie =Datevalue(A1)). Any thoughts on why that might be happening?
In other words, were you not very accurate when describing your original data? Therefore, I always ask to attach a sample to the question - it is very tedious to create test cases and it is very frustrating when you find out that you have created the wrong one  To get the date use the INT() function and format the result as a date. Then subtract this value from the original cell and format it as time. In fact, the date-time is just a number: the integer part shows the number of days that have passed since the start date, and the fractional part is the part of the day, the time.
Another way to fix the “problem” is to create another named range, for example LogDate1, with a formula like TEXT(INT(LogDate);"YYYY-MM-DD") and use this name as a data source for the dropdown list.
Sorted the date/time format, thanks… Sorry for the confusion. The fields were formatted individually as date and time so appeared to me as such but the actual values were combined date/time. I have sorted that out using the int() and subtraction method nicely.
I have cut down the rows to a manageable few thousand but the real dataset is 70,000 rows so very slow processing.
Any thoughts on how to advance this to find the max and average count for extended periods (ie season or even year)?
Any thoughts on how to arrive at a max and average of visitors at one time over longer periods of time (ie week, month) other than manually checking and storing those for each date?
The format of this resource does not allow for long discussions - send me an email johhnsun at i dot ua