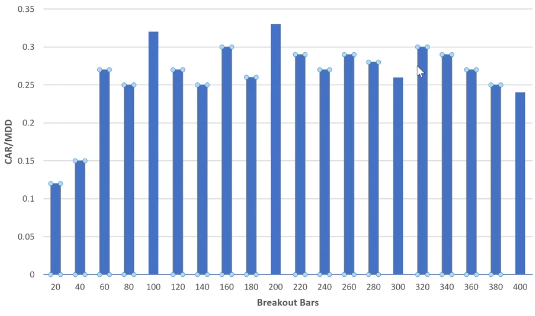
How do I create a chart in Calc to look like this:

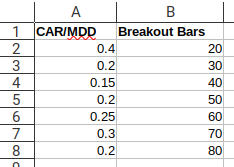
I have columns in my spreadsheet as follows, but cannot work out how to plot one column on X axis, and the other column on the Y!

Thank you 

How do I create a chart in Calc to look like this:

I have columns in my spreadsheet as follows, but cannot work out how to plot one column on X axis, and the other column on the Y!

Thank you 
Thanks JohnSUN 