How to create a graphic from a formula y = f(x) - not from a table

Hello, thank you in advance for your time.

I would like to create some graphics not from a table but from formulas
Example y = ax²+bx+c (with x and y as axes).

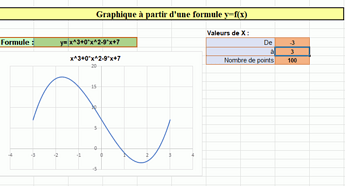
On Excel it is possible according to this tutorial : Graphique f(x)
(file .xlsm is downloadable as example)

I tried to implement it in Calc, but it does not work.

Thank you in advance for sharing another solution
or to find how to implement the Excel file mentioned above :).

I am on Ubuntu 22.04.2 and

Version: 7.5.5.2 (X86_64) / LibreOffice Community
Build ID: ca8fe7424262805f223b9a2334bc7181abbcbf5e
CPU threads: 8; OS: Linux 5.19; UI render: default; VCL: gtk3
Locale: fr-FR (en_GB.UTF-8); UI: fr-FR
Flatpak
Calc: threaded

Thank you in advance for your time and interest, José from France.

A .xlsm file as mentioned in the question should be expected to contain macros. Since neither (VBA-) macros for Excel nor the implementation of Charts in different applications can be expected to be similar I wouldn’t think there can be easy adaptability or “portability” of charts or related macros.

You may however have tried and should inform us of the results. Mainly I would like to know if the Exel-created chart has a property containing the formula - or eventually holds a table of paired values.
If you have access to such a chart: Are you able to paste it into a LibO document and to not get only an image there?
In the original document: Does the chart accept variables referenced for the coefficients (and adapt later to changes in the referenced cells) or need the coefficients to be given as constants?

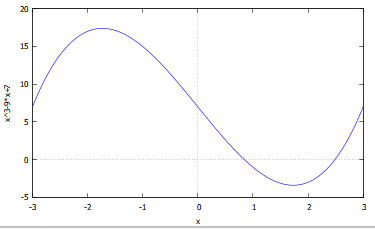
There are cross-platform solutions to tasks of the kind that will never have a functional equivalent in spreadsheet based charting. Charts are mostly used either for simple visualisations of readily calculated tables or for funny impressive hokum. Actual graphing with actual math or statistics in the background is a different job. The example below is made with wxMaxima and included GnuPlot.
grafik
The simple command expression was
plot2d([x^3 + 0 * x^2 -9 * x + 7], [x,-3,3])

2 Likes

I can paste special as Excel chart but double-clicking opens the formula and parameters for X in Calc but any changes damage the graph without updating the curve

Yes. I changed just the formula in Excel and the limits for X to yours

2 Likes

Macros needed under Excel (what version)?

Sorry, I fell asleep last night while trying understand how Excel did this; I still don’t.

If I click the Macro icon in Excel there are no macros listed. It uses Excel 4 functionality, see Turn a string into a formula with Evaluate - Excel Off The Grid

In Name Manager there are two items:

  • x refers to =Feuil1!$I$6+(ROW(INDEX(Feuil1!B:B,1):INDEX(Feuil1!B:B,Feuil1!$I$8))-1)*(Feuil1!$I$7-Feuil1!$I$6)/(Feuil1!$I$8-1)
  • Y refers to =EVALUATE(Feuil1!$C$6)

It seems that Name Manager is part of Excel’s Tables which don’t exist in Calc, Use the Name Manager in Excel - Microsoft Support

1 Like

I wouldn’t expect “Feuil1” to be an automatic sheetname for any locale. it may be something that allows Excel to create persistently hidden sheets not counted together with the ordinary ones. To get a function-diagram-Chart, a process may then create such a hidden sheet to use it for the calculation of an ordinary table which then is referenced by a basically standard type x-y-Chart as its data range.
When the question was posted I felt tempted a bit to write user code for the task. If giving in I would also do it with the help of a hidden sheet (in fact a temporary Calc-document to avoid rare errors with formulas counting sheets) interpreting the formula with the FormulaParser, and creating the pairs of values in two columns.
Having created a xy-Chart then in the sheet, I would copy it again and paste it into a temporary Draw document, this way creating the DataTable. Again having copied the pasted instance, I would be able to paste it into the original parent sheet together with the contained data. …
Do you feel tempted now? If so, follow Oscar Wilde’s attitude: “I can resist anything but a temptation.”

[My way no references into the parent sheet would be allowed so far.]

The predecessor of vba was a macro language that was written into special macro sheets.

Microsoft Excel - Wikipedia (scroll down to “macro Programming” → “History”. It’s called “XLM” and still runs with recent versions of Excel.

Thanks. Yet another info about Excel I happily didn’t miss consciously for many years. Even when I still had to use Excel in some cases, I never wrote or recorded macros for it.

Hello, thank you all for your answers.

@EarnestAl
I think you are close to the trouble source :).

We have Name Manager in Calc (drop box at the right of the formula box : Manage Names..., Ctrl F3)
With F9 (Recalculate) in H1 and C6, I have the right values, even when I modified the settings.
But not in the graphic.

It seems to me, the problem come from “evaluate” function in “y” name. The Function EVALUATE does not exist in Calc.

Please note that, in the tutorial, the author (sorry, I didn’t take account that it was in French) said something like “The EVALUATE function is not more accessible in Excel. But it still exist”.

Your sample .zip project contains an .xlsm file. That means: It is a xlsx file, containing some MACROS. But your sample file not contain any macros. (I can not find them inside.)
.
Then, your sample file contains two cells for the x range limit values, and one more cell for the number of the “calculated” points. Therefore it is logical for me: something will calculate the points of the graph… It is possible in some helper cells, or temporarly in the memory, it is depends on the “macro code”.
.
Finally the macro will insert/manage the Graph with inner x-y values (the sample graph has not source cell range reference.)
.
.
I think it is possible to achieve in Calc.
You need use a named cell for the x values, and one helper cell for the y values. (You can use an invisible sheet - if you want to hide these temporarly values.)
You need put the formula into the y cell, and then you must put the x values cyclically into the x cell. (Not needed the EVALUATE function, the cells can calculate/evaluate the inserted formula) You must store (cyclically) the x values and the y results into some array variables.
Finally you need adjust the inner x-y values of the graph.
.
It is not a simple project…

Yes. It is Excel tables that Calc doesn’t have, Overview of Excel tables - Microsoft Support

Thank you for your time @Zizi64 :).

I am not sure to see what you mention.
It is what the example did about x and y.
I try to put the y formula without the key word "EVALUATE.
Even inside “{ }”

I have the data series with F9 in x and y.
The problem come from the graphic.
How to make the graphic reading the data series :).

With Macros:
Graphique f(x)_Zizi64.ods (24.4 KB)

Great @Zizi64
This is the solution.
The idea with the button is excellent.

Very simple. Thank you.

Thank you @Lader and @Villeroy for your approach.

Have a nice summer, José from France

Anybody with the most basic spreadsheet skill is able to create a table where y = ax²+bx+c with a chart for any range of x.

Just such an experiment
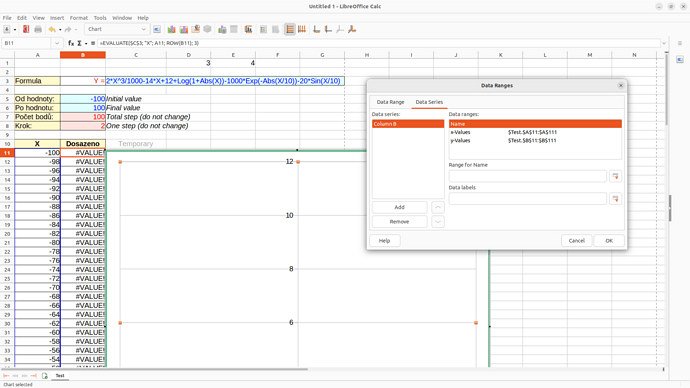
Evaluate Graf X.ods (52.5 KB)

1 Like

Hi @Lader , thank you for this way (which needs to create a table :slight_smile: )

Sorry to tell you, it does not work in my Calc application.

I think, it does not recognize the “EVALUATE” function.

Do I need to add an extension on Calc?

Many thanks for your time and interest.

José from France

The function is a Basic functionembedded in the document.
Tools>Options>Security>[Macro Security]
Leviel:: Highest
Trusted sources: some folder(s) but not your downloads folder.
Load the document from there.

1 Like

Thank you @Lader and @Villeroy

@Lader, your file works (with an automated table, not exactly as the initial example).

and thank you @Villeroy for reminding me the level of security and trusted sources which make the @Lader’s file working :).

Note that the initial file doesn’t work with the same level of security :).
I think the trouble is the way they use the function “EVALUATE”.

Have a nice summer :).
José from France

La solution d’OpenAI ! Chat GPT 3.5
https://chat.openai.com/c/449439ea-7185-4051-bafc-2efc538d0d22

To be checked