How to create a stacked column chart

I am (after days of trying) unable to find a way (or tutorial) on how to create a stacked column chart.

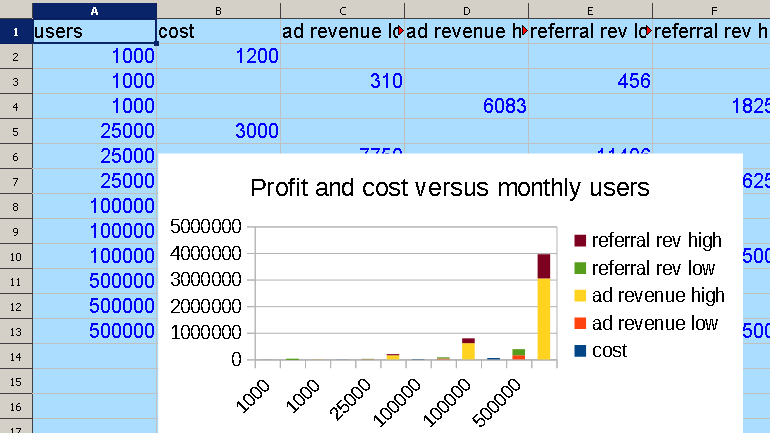
I have a simple chart of projections with “cost, ad revenue (low), ad revenue (high), referral revenue (low), referral revenue (high)” and as the X-axis, monthly users.

I just want to show 3 columns for each quantity of users, not 5:

#users = cost, TOTAL low, TOTAL high

So the TOTAL low is going to ideally be 1 column that stacks the “ad revenue (low)” and “referral revenue (low)” on top of each other, in different colors. Same for the “high” column.

Can this be done? I thought that the way would be to add the “Data Range” but when I alter the Y-axis data range in any way, it turns red and I can’t save. I’ve tried $Sheet1.$B$2:$B$5;$Sheet1.$E$2:$E$5 and $Sheet1.B2:B5;$Sheet1.E2:E5 and a bunch of other options…nothing works.

Thank you for any help!
(attaching a file. Hoping to get the orange and green columns to stack, and the yellow and maroon to stack, with the blue one as is.)
revenue-projection.xlsx (9.9 KB)

https://help.libreoffice.org/7.5/en-US/text/schart/01/type_column_bar.html?&DbPAR=SHARED&System=WIN

Look for the stacked option.

@mariosv Thanks, yes, I’d hoped this would work and it was the first thing I tried, but it doesn’t. It stacks everything, all on top. So instead of getting cost in one column, and TOTAL (low, made of 2 columns) and TOTAL (high, made of two columns), I just get stacks with all five items on top of each other.

Maybe it’s easier to see if I express it as the chart being a range of A1, B1+D1, and C1+E1.

So that the A1 is one column, and the second and third columns both have a split color and are stacked.

Does that explain it? I can’t seem to do this at all.

Please attach a sample file, so people can see what happens.

@mariosv Thank you, I’ve uploaded the file. See anything that I’m doing wrong?

After further research, I think what I want is a “stacked bar chart” for 2 columns and a unstacked bar for the cost. Might there just be a way to get the revenue (high/low) columns to stack, but the cost column to be by its lonesome self?

I also figured out that the documentation uses a semi-colon as a separator and my system uses a comma. I can now edit the Data Ranges value and get it to allow and to save. But still just can’t figure out the syntax for getting this to work. My deadline ran out, too, so I had to opt for just a lone bar and make it clear that bar represents both types of revenue. Oh well. I’d still love to know how to do this…or if it’s not possible, to know I shouldn’t keep trying. :slight_smile:

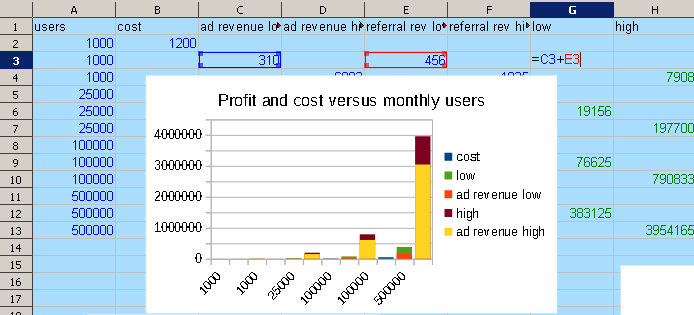
Another option that requires to reorder the data:


revenue-projection LeroyG.xlsx (11.8 KB)

EDIT:
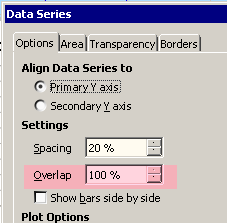
Adding two auxiliary columns, and Normal columns chart type with 100% overlap:
imagen


revenue-projection LeroyG.xlsx (13.6 KB)

1 Like

In Excel you might be able to hack error bars and do this by hand, so long as the number of subcategories was very limited. But in Excel or Calc you can’t do this directly because the program has no way to know how to fold your data into stacking vs. separate bars.

So, you have to do the folding first. After that creating the chart from the folded data is easy…trivial.

The attached spreadsheet uses modular arithmetic and the OFFSET function to do the data folding automatically. In the folded data table, the subcategories are in rows (Ad, Referral) and the categories (Cost, Lo, Hi) are folded into the class (Users) as columns. Since the categories act as a third dimension, they must be listed in a separate category table. Hence, the categories table above the folded data table can really be seen as a depth axis that is flattened out across columns in the folded data table itself.

3D Stacked Bar Chart.ods (26.1 KB)

1 Like

@joshua4 This is amazing, and exactly what I’m hoping to accomplish, the problem is I have no idea how to do this myself. I can plug in appropriate numbers myself…thank you so much. But I don’t know what the “modular arithmetic” and “OFFSET” means, nor “folded data table.”

In the chart, the “1000 cost” label seems off. It should be “1000 Users” with 3 bars: cost, low, and high. And then 25,000 users, with appropriate “cost, low, high”

But still this is really close to what I’m hoping to accomplish. Just have no idea what the category count is, etc.

But I think the key thing here is: What syntax did you use in making the chart to get it to show the orange and blue in the same bar? If I could understand that, I think I could get it to work on my own.

I believe that the “1000 Cost” concern is because the labeling is a bit of a cheat. The idea is that the 1000 is the Users, and “under” that are Cost, Lo, and High. I suspect formatting the VLOOKUP header row in the folded data table could alleviate the concern…perhaps use VLOOKUP(…) & “Users” & CHR$(10) & … or something to note the Users but push the Cost over. Or perhaps using other formatting and then placing an explicit “Users” below the horizontal axis as an axis label.

As for implementing this with your data set, really you would need to analyze the folded data table. You must realize that there is no ‘syntax’ to make this happen. The end result (the bar chart) is a very simple, automatic chart with the few, basic features as listed directly above the chart.

Understanding how to prepare the data is the key. The modular arithmetic is just a way to create the 0 0, 0 1, 0 2, 1 0, 1 1, 1 2, … sequence across the top. Along with the 0 1 2 sequence down the left, the numbers are fed into the OFFSET function that then acts like a chess player making adjustable “knight moves” to pick out the data in such a way that the Calc charting system will automatically create the chart you want.

That “way” is first of all to conceptualize the table just as Users (User Counts) across and Ad and Referral down. Now imagine that each cell in this simpler table “goes back into the page” for a total of three cells deep. The “surface” is the Cost, then next back is the Lo, then further back is the Hi. But Calc cannot graph from a rectangular solid, only from a rectangle. So, now splay (fan-out) each of these “deeper” cells left-to-right. This is the purpose of the modular math; the row 0 0 0 1 1 1… ultimately (via OFFSET) picks which Users count (1000, 25000,…) while the “smaller” row below it with 0 1 2 0 1 2 picks the “depth” of the cell being splayed (0 is surface, 1 is next back, 2 is next after that, so Cost, Lo, Hi).

Now, with the data properly displayed so that the data you want stacked together show up in the same unique columns, the stacked bar chart is automatic. The only thing remaining is to create horizontal axis labels that clarify the chart. Here I didn’t quite succeed, evidently, but it boils down to just concatenating values and formatting them to finesse a convincing result. These are the values that create the header row in the folded data table. (This might be done with clustering in Excel–I haven’t tried–but Calc doesn’t have chart clustering).

Okay @joshua4 again, thank you so much for this. I really appreciate the time not just to make the chart but also the explanations. It sounds like in the above you’re just talking about a 3 dimensional array, but that from that, you’re expressing that 3-d data in a 2-d form. Is that right?

In any case, it’s very useful. Thank you!

Yes. You are just flattening the 3D array in a way that will naturally produce the desired chart.