How to edit data series in a pivot chart?

I’m trying to figure out how to edit the data series used in a pivot chart. Creating a chart from a pivot table selects all the columns/series in the table automatically. I can manually select a series from the chart itself and delete it, but I can’t seem to find a dialogue box that allows me more control.

Ultimately I’d like to drive a series of charts from a single pivot table using the filter box to set chart values. At the moment I can’t limit the series used using the manual method described above because some series are tiny compared to others and I can’t select the slivers on the chart to delete them.

I hope I’m describing the problem correctly…

Online-Help:

Welcome to the LibreOffice Calc Help

Type pivot in the search bar.


English documentation

Thanks for the link to the documentation and the instructions for how to use it.

Unfortunately the task I’m looking for doesn’t seem to be listed. I can see all the tasks associated with editing a pivot chart, but not how to select the pivot table items to be included.

Hello,
Cannot quite grasp what you are wanting to do that is not there already. What about the drop downs on the chart itself?
.
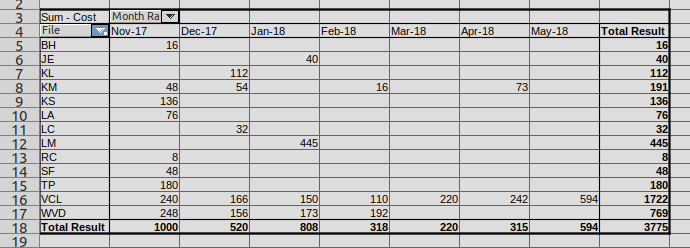
Pivot table:
Screenshot at 2022-09-12 14-01-05
.
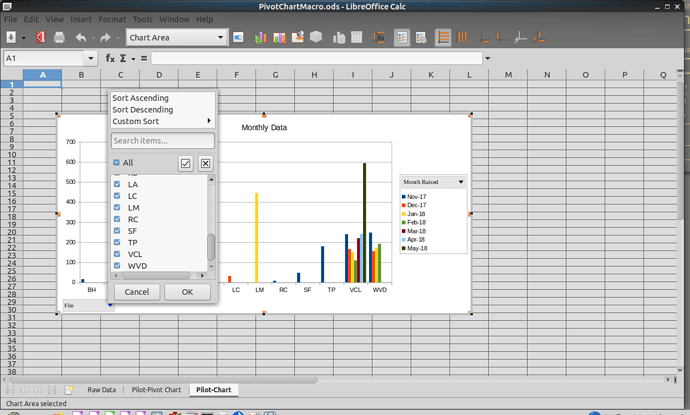
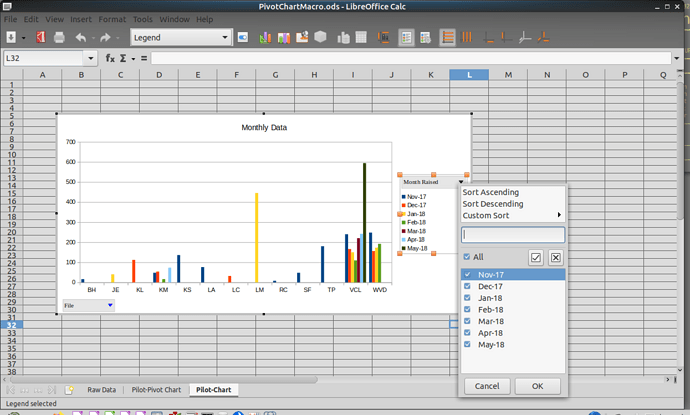
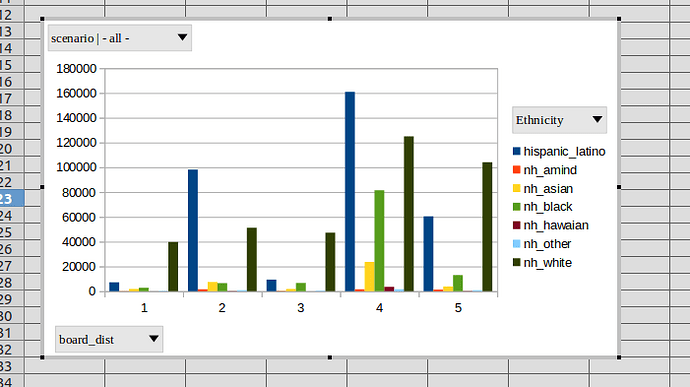
have selections on chart itself for File and Month Raised:

.
Just check/uncheck what is wanted.

Ah that 3rd image is what I’m after, but for the life of me can’t figure out how to get that to show… that seems to be the ‘list’ I’m after… how do you get to that?

Double left mouse click on chart to select it (not single click). Then left mouse click on grey title bar - here noted as Month Raised. Anywhere on that bar should work.

Aargh… That’s exactly what I need but I can’t get it to work for some reason. I doubt this is a v.7.3.5 vs v.7.4 issue… but can’t imagine why. I’m using Linux Mint, but it doesn’t seem to work in Windows either.

Hopefully this attachment works, just some data I mocked up that will contain the sheet with the pivot table and chart:

test dynamic charts.ods (31.2 KB)

Any advice you can provide would be great. Thanks for finding the solution - hope I can get it to work!

Either use the pivot table controls’ filters scenario or board_dist, or

  1. either double-click the chart, or right-click and from the context menu choose Edit
  2. click on one of the boxes with a down-arrow, scenario | 2 or board_dist

@DPSSpatial
As I am certainly not proficient with pivot tables, there is probably an easier method. Did a minor re-arrangement of data on sheet3 then new chart. What you wanted? Please note in messing around may have changed original pivot table and chart.

Edit - added a bit more data:

test dynamic charts.ods (38.4 KB)

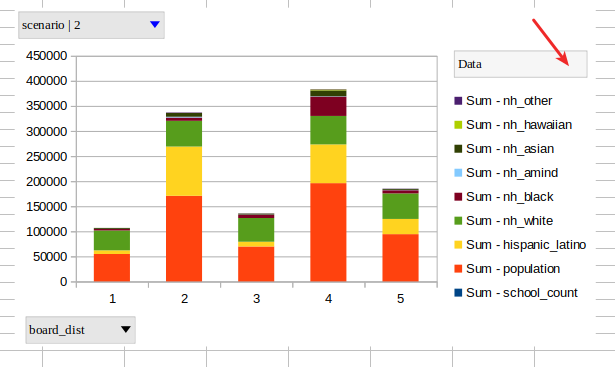
Thanks for checking the file - that wouldn’t give me control of the columns / series, just the rows and filter. The solution is in the legend double-click action, but I don’t seem to have that for some reason.

@Ratslinger - thanks for checking this. The solution is in the legend double-click that I can’t seem to access. I will have to do more digging in order to figure out why. Ultimately I’m looking to put together a single table with a wide array of ‘series’ / columns. I would like to drive 3-5 charts from that single pivot table using the ‘filter’. This is for a re-districting scenario tied to QGIS and PostGIS. It works great, but I’m just pushing it a bit trying to get the single filter to control multiple charts - and that also works, but limiting the series/columns in the charts is the reason I need to access the list opened via legend double-click. Thank you again!

I do not understand. The posted sample does give you (data moved around) the selection in the legend:


.
What am I missing?

Yes that’s right - what’s missing is I cannot access that menu for some reason…

Not how it was noted to be done in my previous comment.

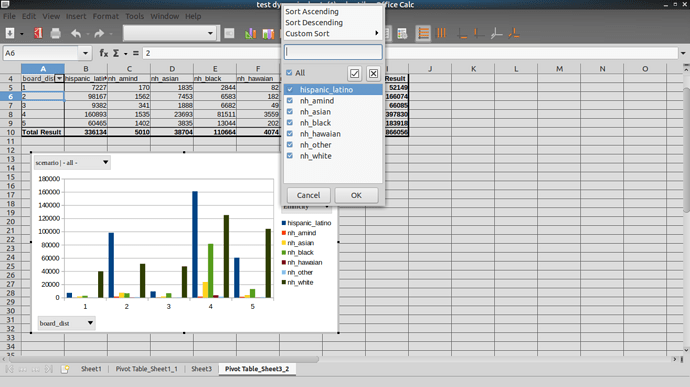
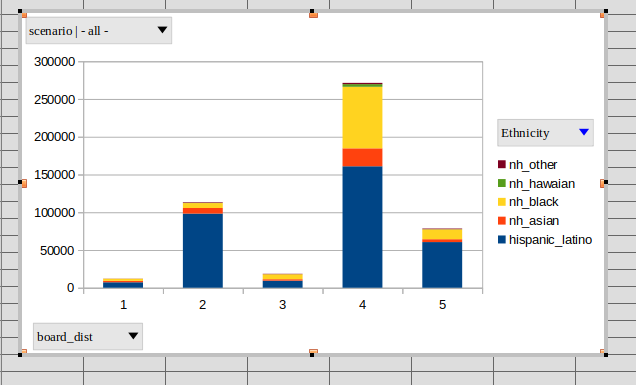
Can you access the drop downs for scenario and board_dist? If so, the same is true for Ethnicity. Double click on the White background of the chart first. This will select the chart - has border with black dots in corners and line centers:


,
Then just left mouse click anywhere in Ethnicity bar (has down triangle on its’ right).
.
Tested posted sample multiple times and it works properly using Linux Ubuntu 20.04 and LO v7.4.0.3

OK I see what you’ve done to the source data - sorry to have missed that. That will require some extra steps on the back-end of my process - this table is a result of a postgresql query - I would have to pivot the data in SQL to achieve what you did in the calc/spreadsheet. With that said, I’m struggling to understand why the option isn’t available in the original way I have structured the data/pivot table. Thanks again!
image

@DPSSpatial
Your posted image is from your original chart on sheet Pivot Table_Sheet1_1 while my post is on Pivot Table_Sheet3_2. That is the reason you cannot select the drop down.
.
Also, just checked that this works on Win 10 with LO v7.2.5.2
.
Edit:
.
Changed chart to stacked bar & removed couple of stats for Ethnicity resulting in:

Screenshot at 2022-09-13 10-12-42
.
Seems to be what you want.