Hi, we are learning to use Excel in my Mechanics class and I have been following along with LibreOffice.
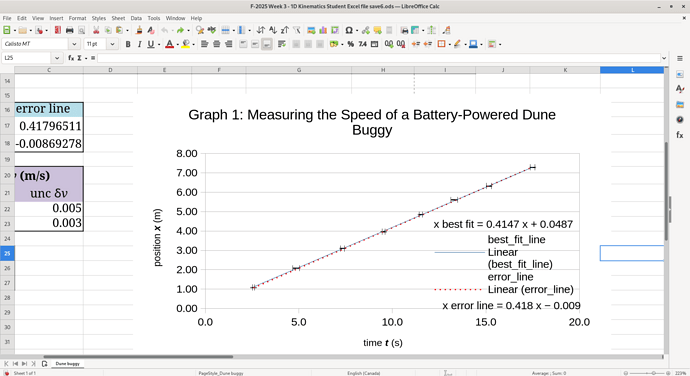
This is what my chart currently looks like:
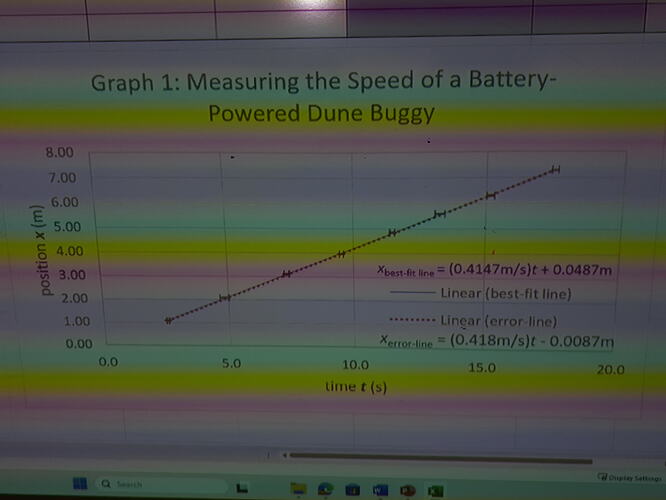
And this is what the teacher’s looks like:
When my teacher modified the trendline equation, he double clicked on it and directly edited it’s text.
But for me I can’t find a way to do that, so I modified the name of the Y variable instead. But that seems to mean I can’t add subscript like he did.
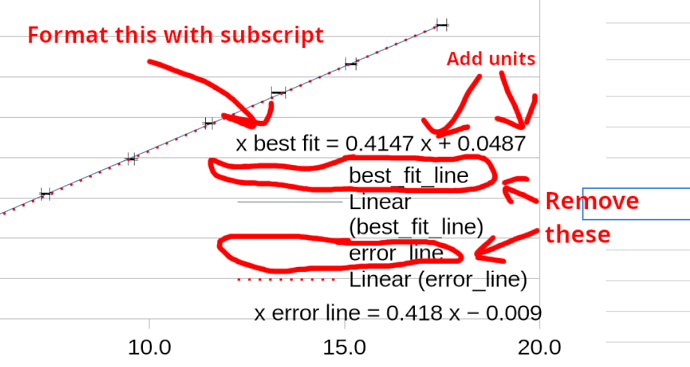
So here are the things I would like to do visualized:
F-2025 Week 3 - 1D Kinematics Student Excel file save6.ods (55.1 KB)
Any help is much appreciated


