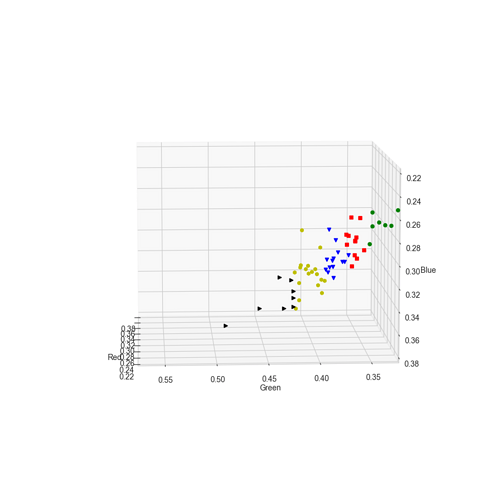
I have a 3D scatter graph plot written in Python3. I would like to be able open it on a worksheet like the graphs that are the Wizard offers. below is the worksheet. It is saved as .xlsx as that was the easier format to get the script to run (I am at best a novice with Python). The 3D graph pulls coordinates From columns A, B, C 9x,y, and z). Markers are selected in Colum E and color of marker in column F. Column D is simple for identifying data set and is not plotted.
3D PLOT WORKSHEET TEMPLATE.xlsx (8.6 KB)
Here is a image of the plot, the window when open allows the graphh to be rotated.
I can upload th ePython code, but wasn’y sure that was allowed.
I have read that Python works with Calc- is there a way to view the code used in the wizard to see how it is constructed.
The script runs quick, but the only way to update is to close , edit data in worksheet, save and rerun script.
Thank you to anyone who has any ideas.

