How to format category-based data labels in charts?

How do I format the category used as data labels in a LibreOffice Calc chart?

I have a scatterplot drawing data from three colums: X (percentage), Y (number), and date. The date is the column I want to use as the data labels for the series. In the cell, the date is formatted as “2020-10-10”. However, in the chart, the date is showing up not as “2020-10-10” but as the underlying date number formatted as a percentage (the same format as used in the X column and on the X axis. How do I get it to appear as a date?

(By data labels, I mean the labels that appear next to each data point on the graph–as documented here–not the numbers that appear next to the tick marks on the X or Y axis. This is the desired effect, where “12/01/09” is the data label:)
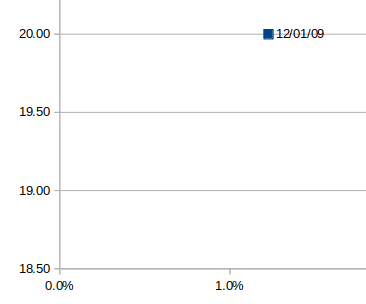
image description

Here’s what I did: In Data Ranges, the data appear in one series, with X-Values set to the X range, Y-Values set to the Y range, and Data Labels set to the date range. Right-click on data series and select “Insert Data Labels.” The X values appear next to each data point. Right-click again on the data series and select “Format Data Labels.” The Data Labels popup appears. Click on the “Data Labels” tab. Uncheck “show value as number” and check “show category.” The dates appear on the chart, but formatted as percentages, which is hard to read (to say the least).

I am using LibreOffice Calc 6.4.6.2 on Ubuntu 20.04.1. Thank you.

X (percentage), Y (number), and date.

What is the sense to have a scatter type chart using X (percentage) as a data range, if you want the date for the X-axis? I really don’t get how you defined your scatter chart - could you upload a sample file (may be with modified fake data) ?


> How to format category-based ...

Generally speaking: If you want a category-based … chart, then the proper chart type may be a “line chart”, which uses categories for the x-axis.


Please do **not** use *Add Answer* but **[edit](https://ask.libreoffice.org/t/how-to-format-category-based-data-labels-in-charts/62860)** your original question to enhance the details of your question and/or to upload sample file(s) (answers are reserved for solutions to a problem on this Q&A site). Thanks in advance …

Thanks, but I don’t want the date on the X axis. I want the percentage on the X axis, the number on the Y axis, and the date as the data labels. The data labels are the labels that appear next to each data point on the graph, not the numbers that appear next to the tick marks on the X or Y axis. See LibreOffice documentation here.

I figured out an answer to my own question, but it is clumsy: If A1:A100 contains the dates, create a second range at B1:B100, and use the TEXT function to convert the date to text. For example, B1 would contain =TEXT(A1,“MM/DD/YY”). Then set the data labels to reference B1:B100 instead of A1:A100. But I would still appreciate knowing if there is a better way.