Hello!
In Calc, I have a set of data such as:
ID	Gender
1	Female
2	Male
3	Male
4	Female
…	…
99	Male
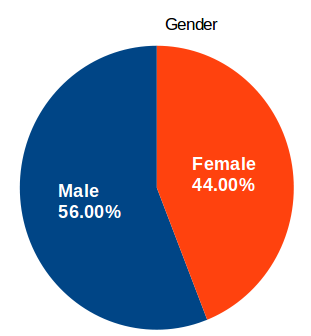
I would like to generate a pie chart out of it that would look like this:

Do I need to create an intermediate table summing the different options I have in the “Gender” column or is there a better, automated solution for this?
(I have other columns with more than two options and I would like to do similar pie charts for these as well)
Thanks in advance!
