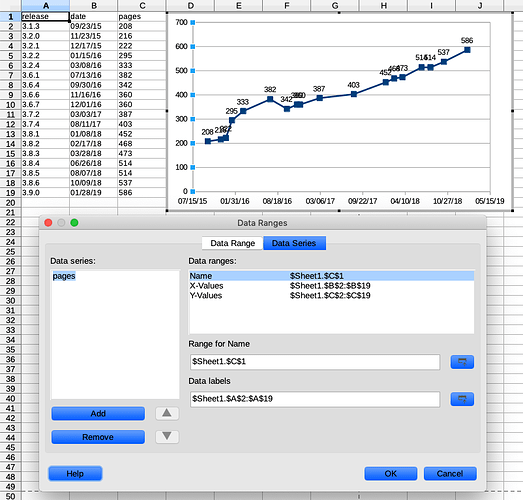
I don’t understand what’s going on here. I have column A defined as the range for the data labels, but Calc is pulling the data labels from column C.
When you created the chart, did you highlight all the data in columns A, B and C, and then check the box for “Use first column as labels” under the data ranges tab, then finally delete whichever data series was defined that used the data from column B, leaving the chart definition dialog with only data in columns A and C?? There other ways, of course, but this always works for me.
It’s a bit of a head-fu*…dge*, but you’re right. I had tokeep playing around with a small example, jumping to and fro between the ‘Chart Wizard’ dialogs and what/how I’d selected the cells I wanted.

