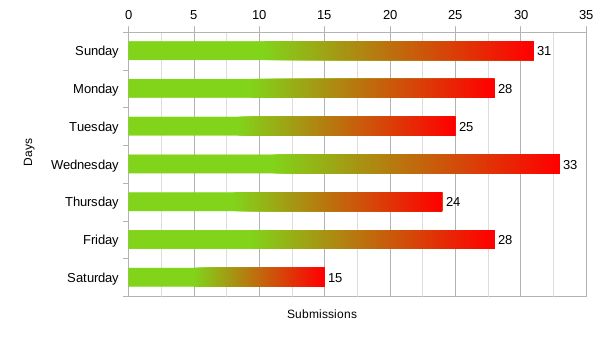
At present, the gradient fill in the series is showing full gradient from green to red as in the following image:

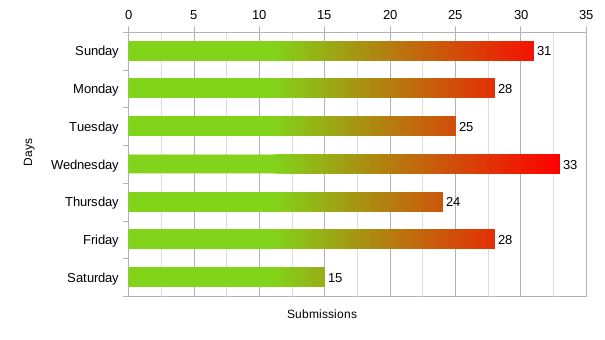
What I want is fill the gradient according to the value of the data series like below:

Clear difference is visible in “Saturday” series. In the first image, the gradient is full from Green to Red, but in second image, which I created through editing the first image in Krita, is showing gradient of Green color only, it doesn’t reached to Red.
How to do this in chart in Calc?

