Hello!
I have done this one year ago, but as soon as a new year come in, for the life of me, I cannot remember how to do it (I shall keep notes this time):
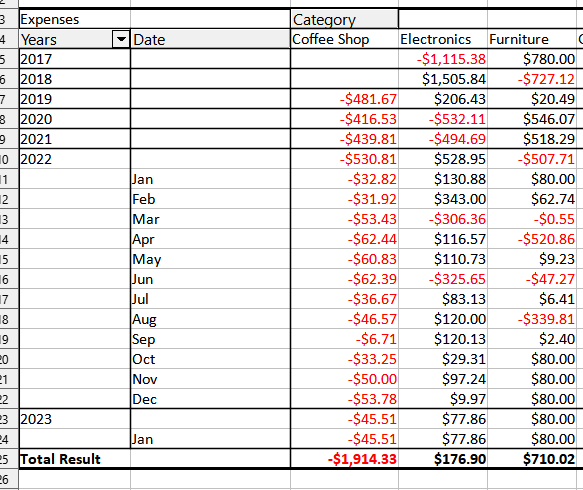
I have a table with every expense I go through, and I create a summary pivot table. This is what I want to do in the pivot table:
(in parenthesis: the respective rows in the picture for reference)
- Group by year and month (Rows 10 to 24)
- Have the year show a subtotal per section (Row 10 and 23)
- When the year is over, I collapse the year (Row 5 to 9)
I was able to do it in previous years, but every year is a struggle and this time. So far I’m able to ungroup and group by year and month, but I cannot reproduce to have the summary total at the year level and to collapse individual years.
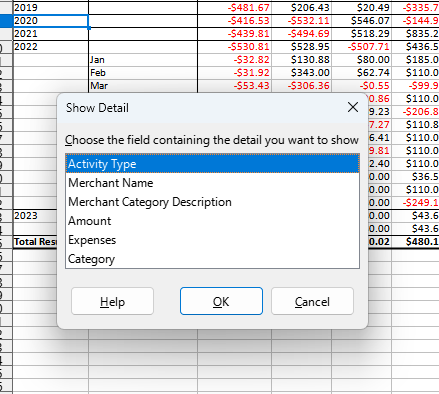
This is a screenshot of what it looks like when working (although, now I want to collapse 2022):

Any help will be greatly appreciated.


 . It doesn’t seem to be the way I was able to do it before. In my old file, in the Pivot properties the Row Field only has “Date” on its options instead of “Year” and “Date”, and there are no Subtotal options selected. But investigating this more I don’t think will bring any value.