I have a pie chart based on a data range which contains zero-values. I would like to hide corresponding labels from chart legend, so it only displays the ones that are actually presented on the pie. example
Hello,
if your data has a lot of zero values randomly distributed, you might want to use a filter
-
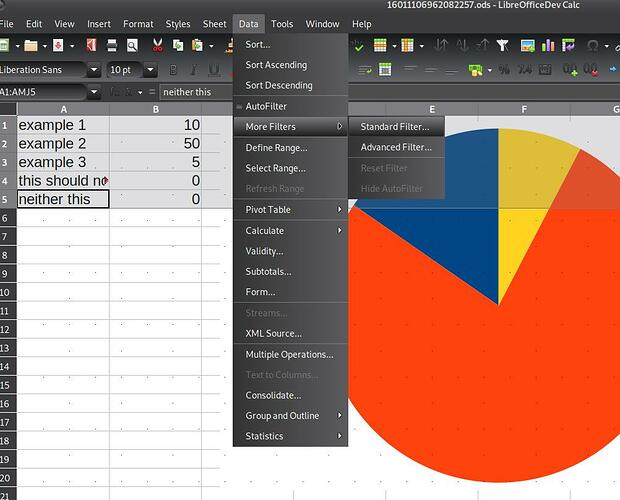
Mark all data rows including the zeros values
-
Menu
Data→More Filters→Standard Filters ...
-
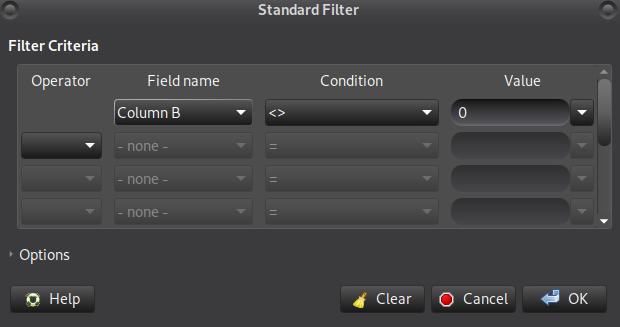
Specify filter rule which rows to show/display

-
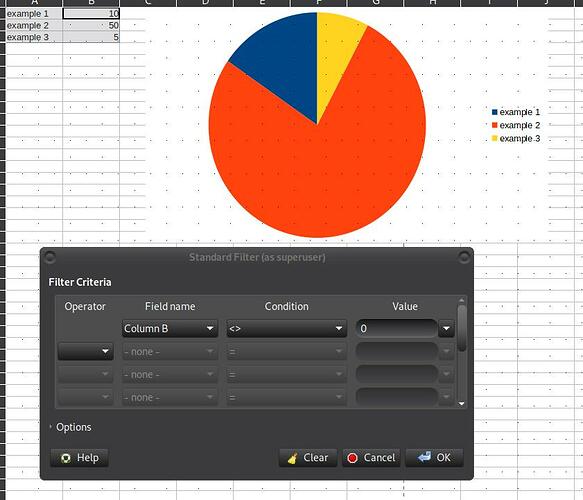
Result
And here the modified example with the activ filter:
16011106962082257.ods
Hope that helps.
To show the community your question has been answered, click the ✓ next to the correct answer, and “upvote” by clicking on the ^ arrow of any helpful answers. These are the mechanisms for communicating the quality of the Q&A on this site. Thanks!
Have a nice day and let’s (continue to) “Be excellent to each other!”
Ask / Getting Started:
https://wiki.documentfoundation.org/Ask/Getting_Started
you didn’t show chart legend. I tried and that does not help at all. it’s not about hiding the rows, but labels in the legend  what you’ve shown has nothing to do with a chart…
i updated my answer with the “chart legend” aka result view. As you can see, the legend doe not contain the zero values, after applying the filter. Hope that helps.
@igorlius thanks, but screenshots aren’t that helpful since I had different result… could you attach the example so I can play with it?
Sure, i’ll add the file, to my answer.
Also can use menu Data - AutoFilter, and unselect ☑ 0 on column B.
Only select the cells which contain values of more than 0, then start the charts assistant. If not selected the chart won’t display the null values…
quite obvious  although those cells values change dynamically depending on other cells, I don’t want to manually update the chart each time that happens…


