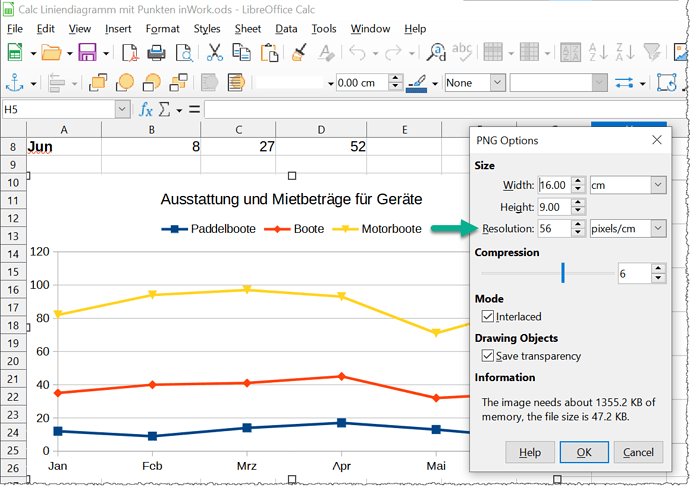
I’ve made some plots using Calc and exported it as an image with extension as PNG and TiFF.
However both the plots exported comes with lower resolution. Means, the plots seems pixelated and loses its quality.
The dimension of plots made in Calc are 15x10 cm. How can I improve the resolution of plots?
I’m using LO version 7.1.4.2 on Windows 10 64 bit.
System hardware is Dual Core processor 3.0 GHz, H61 motherboard with integrated graphics.
Attached is a sample plot in PNG format 1.png for reference.
- Mark your graphic.
- Choose
File>Export. - Put a check mark at Selection.
- Choose for example the file type PNG.
- Click on “Save”.
- The dialog offers you to adjust the Resolution and the Compressiont rate.
what is the purpose of compression?
Now this is primarily not a LibreOffice issue, although this feature is used by LibreOffice; see:
[Image compression](https://en.wikipedia.org/wiki/Image_compression)
Compression ratio, summarized in my words:
Images should always be as small as possible in their storage size (kB). To achieve this, one uses compression, for example. Compression is a mathematical function that eliminates redundancies in the image. For example, the use of the same color tones. The higher the compression rate, the more the color tones can deviate for the calculation. This has the consequence that at a high compression rate the image is no longer attractive.
In the end, the user has to decide in the comparison of a view (before/after) whether the compression rate is coherent for him.
Some workaround tips:
Zoom to the diagram and then make a screeshot. Crop and save the screensot image.
Depending on the resolution of your display, maybe it will give a better result for you.
…
Or try to enlarge the diagram before you export it.
try to enlarge the diagram
This way text, numbers and marks will be seen smaller.
yes. it won’t improve the resolution.

