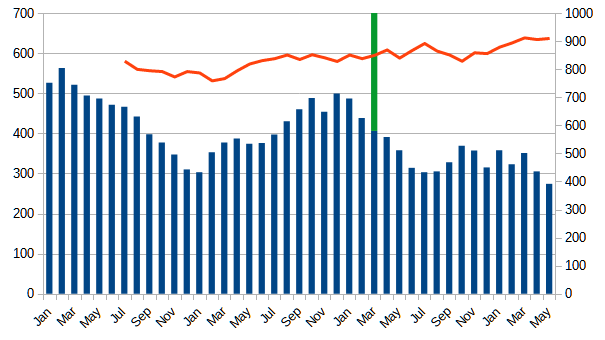
The attached pdf shows a bar chart related to the left hand Y-axis and a line chart related to the right hand Y-axis. I wish to insert a vertical line from a specific point on the X-axis up to the top grid line, but all my attempts thus far have resulted in failure and adversely affected other features of the chart. Any suggestions as to how I can insert the vertical line greatly appreciated
Energy Consumption Chart.odt (23.7 KB)
Welcome! Do you mean something like this?

This is not difficult. Just add another column to the data table for the chart with a formula that will return the maximum value for the data column if the date corresponds to the desired month and an empty string for all other cells. I built this graph with a formula in an additional column like as
=IF(A2=EOMONTH(NOW();-1)+1;MAX($B$2:$B$42);"")
Or with stacked columns, add -B2 to the formula, if 2 (for A2 and B2) is the row with the specific point.
Thank you for your suggested solutions, but what I’m really trying to achieve is not an extension to an existing bar but rather a thin vertical line between two adjacent bars. Would that be doable somehow?
Hello @TeckVet,
I just found a possible solution.
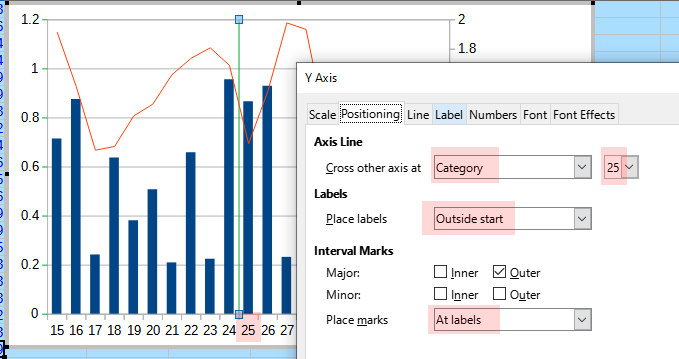
You must edit one Y axis, change where it cross the X axis, leave labels Outside start place, and place interval marks At labels.

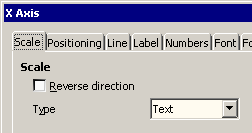
First column must be formatted as text (not dates), otherwise the Y axis remains in its original position. Not sure if this is a bug. Please, see answer at How to get rid from unused data on chart - #2 by Villeroy

Note that interval marks (in the left Y axis) get its color from the axis.
