I have 20 years of daily temperature data, and want to plot all of it. Calc does that very nicely, but I want to label the x-axis with the year, only, and I can not see how to do this. Can anyone help?
Please attach sample file, with notes a bout what you want achieve.
Hello,
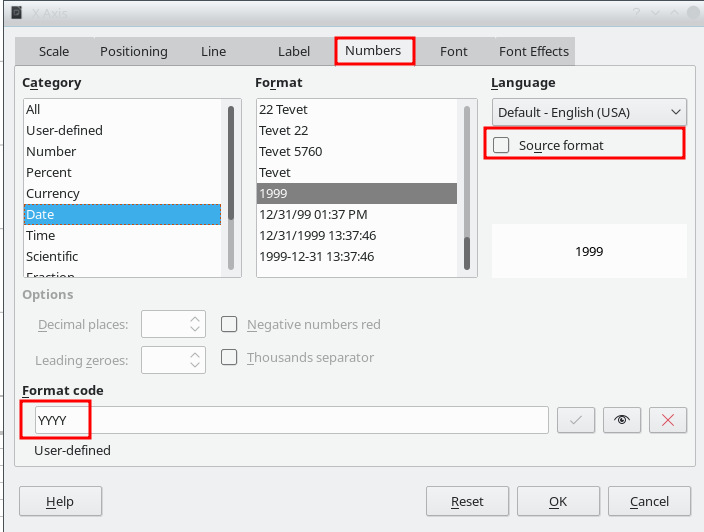
Background: In general Calc uses the Source format for the labeling of the axis. Fortunately there is a way to tell LibreOffice to use another format for the labeling. To achieve this do the following.
- Select your x-axis
Right Click -> Format Axis ...- Select tab
Numbers - Untick option
[ ] Source Format - Set Format Code to
YYYY - Click
OK
See the following screenshot:
Hope that helps.
If the answer is correct or helped you to solve your problem, please click the check mark ( ) next to the answer.
I think we are the right track. When I do that, I see the column with the labels highlighted, but they still don’t show up on the chart. I have 7300 lines of y-axis data, and only 20 x-axis labels, space out every 365 lines, if that makes any sense. I could send a screen shot, but I don’t see how I can attach it.

