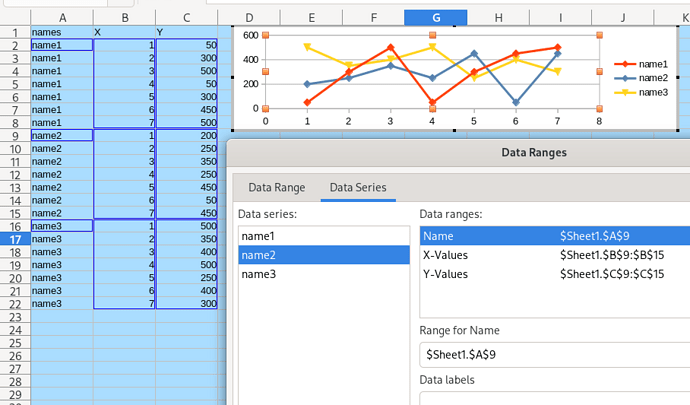
I have data in 3 columns, columns A contains names, it can have 3 possible values. Column B contains numbers from 1 to 7 and columns C contains values in currency format.
I need to put on the X axis the numbers in column B, so from 1 to 7. On Y axis I’ll need to put column C values with steps, so for example 100, 150, 200 etc. Column A will be in the legend, there should be 3 lines in this graph not a single line like I’m getting. Each line dot should sit at coresponding value, so if I have a value of 125 should sito between 100 and 150 etc…
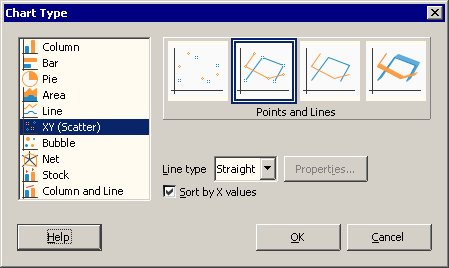
What I’m doing, is selecting the table and click the graph button, I select lines with dots but I get a single line with all the values, not three lines. Also it is putting the names in X axis, how do I fix this?


