How to set two series of bar chart side by side tied to the primary and secondary axes (to get rid of overlay behavior)?

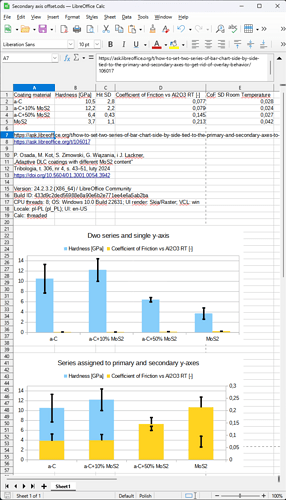
How can I move away two separate series assigned to different y-axes?

There is one data series of max values ranging up to 14,000 and another to 0.2. I want them to be scaled according to primary and secondary y-axis. But when I’m set this series to different y-axes, they are displayed at the same position. Simply second data series covers the first one.

Steps to edit:

  1. Double click on chart (or Right-click → Edit)
  2. Select desired series (by dropdown menu or clicking on the chart)
  3. Format → Format Selection… (or ‘Format Data Series…’ directly on chart)
  4. Options (tab) → Align Data Series to: ‘Secondary Y axis’

Data on page 47:
https://doi.org/10.5604/01.3001.0054.3942

Secondary axis offset.ods (38.4 KB)

Attach a spreadsheet document (.ods) containing yor example data and the charts.
Somebody trying to help you may need to check his (f/m) ideas. The images are useless then.

1 Like


Secondary axis offset Grantler.ods (44.8 KB)

3 Likes

The central idea is to insert fake data series assigned to one or the other y-axis to reduce the width of the columns.
However, Lupp lacks experience with error bars. You may get that better.
Piotr285_SecondaryAxisOffset_ReLupp.ods (41.3 KB)

===Editing===
@Grantler’s solution is, of course, the appropriate one. I would, however, have preferred again a .ods file (containing the dialog image) over the image as an attachment.

3 Likes

Thank you @Lupp!

For the sake of Excel interoperability your solution is better now than @Grantler’s one, since tdf#157016 bug is not fixed when you gave this proposition.

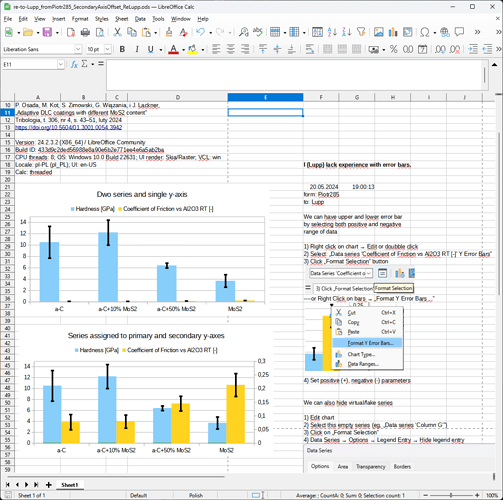
We can also improve this chart to have both positive and negative error bars and to hide fake data series, by doing the following:

Show (+) and (-) error bars

  1. Right click on chart → Edit or doubble click
  2. Select: „Data series ‘Coefficient of Friction vs Al2O3 RT [-]’ Y Error Bars”
  3. Click „Format Selection” button
    or Right Click on bars → „Format Y Error Bars…”
  4. Set positive (+), negative (-) parameters

Hide virtual/fake series

  1. Edit chart
  2. Select this empty series (eg. „Data series ‘Column G’”)
  3. Click on „Format Selection”
  4. Data Series → Options → Legend Entry → Hide legend entry

re-to-Lupp_fromPiotr285_SecondaryAxisOffset_ReLupp.ods (80.6 KB)

Thank you @Grantler!

Your solution is smoother than @Lupp’s one, but as of the existence of tdf#157016 bug we loose ‘Show bars side by side’ setting at save as XLSX because of lacks in OOXML handling by LibreOffice (at least in 24.2.3).

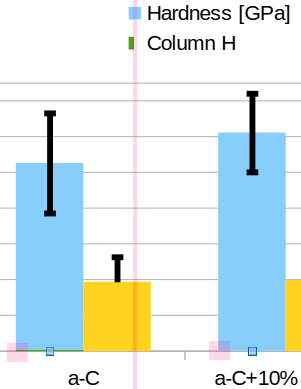
You can set the serie background color to None (or the same blue), to avoid the base line of different color (green for column H zeroes, at the base of Hardness).
imagen