Hello everyone,
I’m trying to use ‘assume zero’ on data series in a chart with dates on the x-axis.
Whenever i try to use it the x-axis get’s messed up and shows dates starting with 1999 instead of the entered values.
Is there a trick, so it only shows the entered dates?
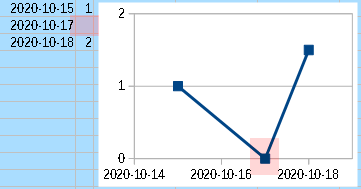
Don’t leave a blank cell in the dates column when there is no data. The number 0 date is 1899-12-30.
If you secondary click on the chart line and choose Format Data Series… - Options tab, you can set how LibreOffice will Plot missing values. Assume zero will bring the line to Y=0 if there is a valid date value in a row without its corresponding data.

Tested with LibreOffice 6.3.6.2 (x86); OS: Windows 6.1.
Add Answer is reserved for solutions.
Press edit below your question if you want to add more information; also can comment an answer.
Check the mark (![]() ) to the left of the answer that solves your question.
) to the left of the answer that solves your question.
