How to use cell content as a chart title or subtitle?

I have a Calc spreadsheet of data with domestic energy meter readings (gas and electricity) and bills received against the date of the reading or bill. I have charted the data but would like the title of the chart to reflect the date range of the charted data. It’s easy to generate a cell with the necessary start and end dates formatted as desired (eg 'Energy usage from to '), but how to select this as the title of the chart? Is this possible - or even the right approach?

LibreOffice Calc Version: 4.2.4.2 Build ID: 420m0(Build:2) on Ubuntu 14.04 64bit (Trusty Tahr)

Any help will be much appreciated.

Reading on the help not possible:

Help Chart Titles

But with charts there is a couple of simples solutions, not exactly the same, if you are not to move the chart alone, but moving it with their underlaying cells. It’s possible e.g. have several charts to simulate one with different types.

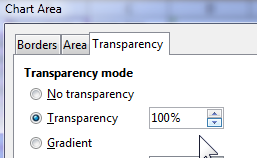
1- Making transparent the Chart area, lets you put what you like in the underlaying cells. Chart elements are over the cells.

Chart Area Transparency

.
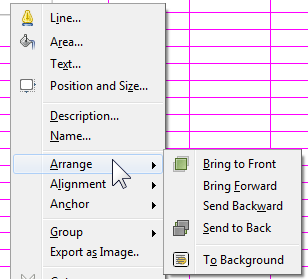
2- Sending the chart to background, with chart not selected right-click on it - Arrange - To background, but in this case is needed to use the navigator [F5] to select the Chart. Cells are over the Chart.

image description

.
.
.
Attached is an example mixing chart and cells: Chart with horizontal stacked bars.

I made a test and was not successful as well. As your idea looks to me like an interesting feature, I recommend to file an enhancement request here: https://www.libreoffice.org/get-help/bug/?enhancement=yes

It would be nice if you post the bug number here to enable others to add comments.