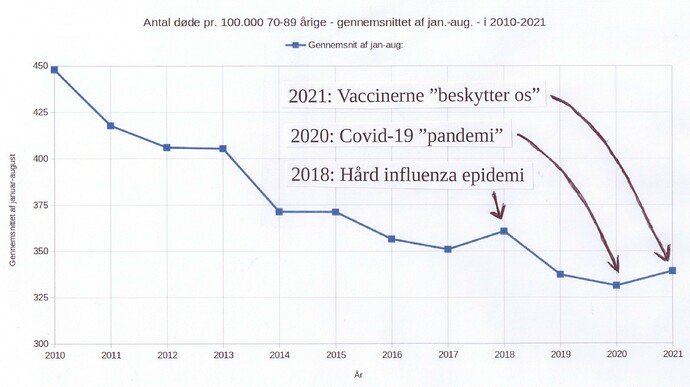
I gave up finding a way to do what you see on the image below. Instead I printed it out, taped on the comments and drew the arrows and scanned in the result… I felt somewhat ridiculous…  Is it not possible to do something like that on a chart in Calc?
Select the text box (click on it) then right click and choose “Text” from the drop-down. This should let you edit all the text box properties, like text position it the box.
I don’t know what version LO you are using… I think you are probably not seeing the drawing toolbar. Make sure the chart is selected by clicking on it and seeing the corner adjusters. Then use menus to go to View->Toolbars->Drawing. Now you should see the drawing tools on screen. Select and use text box, arrows, etc., to label the chart.
-hink
Yes! Thank you!
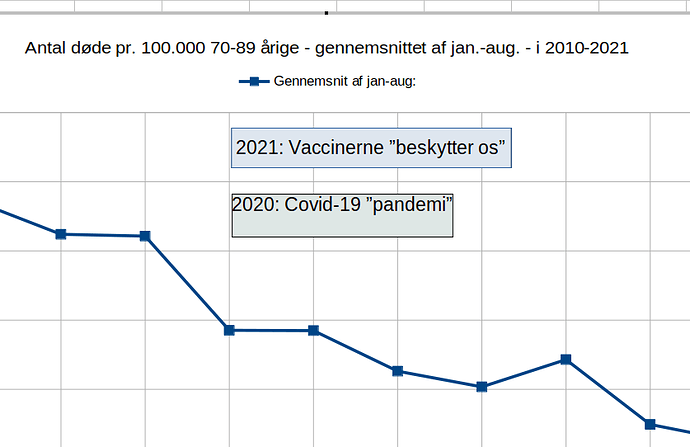
That works - more or less… The first text box looks OK. But I can’t seem to center the text in the second text box. Where do you do that?
(Sorry for not mentioning that I have LibreOffice versions 6.4 and 7.1.)
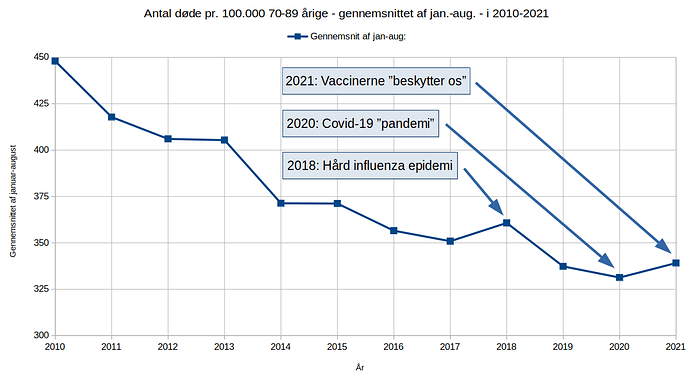
Well… I deleted the second text box and copied the first one, then changed the text. That worked. But I still feel that something is not working as it should. This is kind of confirmed by the fact that the first time I tried copying the text box, LibreOffice crashed… Here is the resulting chart:
This graph is relevant for the general public!
It’s the number of deaths per 100,000 Danes of age 70-89 years - in January to August - during the last 12 years. It shows that there wasn’t really any covid-19 “pandemic” in Denmark. And this year - where most of this age group was vaccinated by the end of April, there is an increased amount of deaths compared to earlier years. Leading to the logical conclusion that the vaccines are more deadly than covid-19 ever was. So the text boxes say:
2021: Vaccines “protect us”
2020: Covid-19 “pandemic”
2018: Bad flu season
I confirm a crash trying to use the arrows in the drawing menu. In fact, I could not place any block arrows, maybe I don’t know how. I selected one and expected the mouse to place/draw it, but nothing. Then crash. The free-form line seems to work. Placing text sometimes works on chart, sometimes not, sometimes crashes. Linear arrow does place.
Version: 7.3.2.2 (x64) / LibreOffice Community
Build ID: 49f2b1bff42cfccbd8f788c8dc32c1c309559be0
CPU threads: 8; OS: Windows 10.0 Build 19043; UI render: default; VCL: win
Locale: en-US (en_US); UI: en-US
Calc: threaded
By the way Henrik - nice graph - but hasty interpretation IMO 


