Sample Data
a
a
a
b
b
b
b
b
z
z
z
z
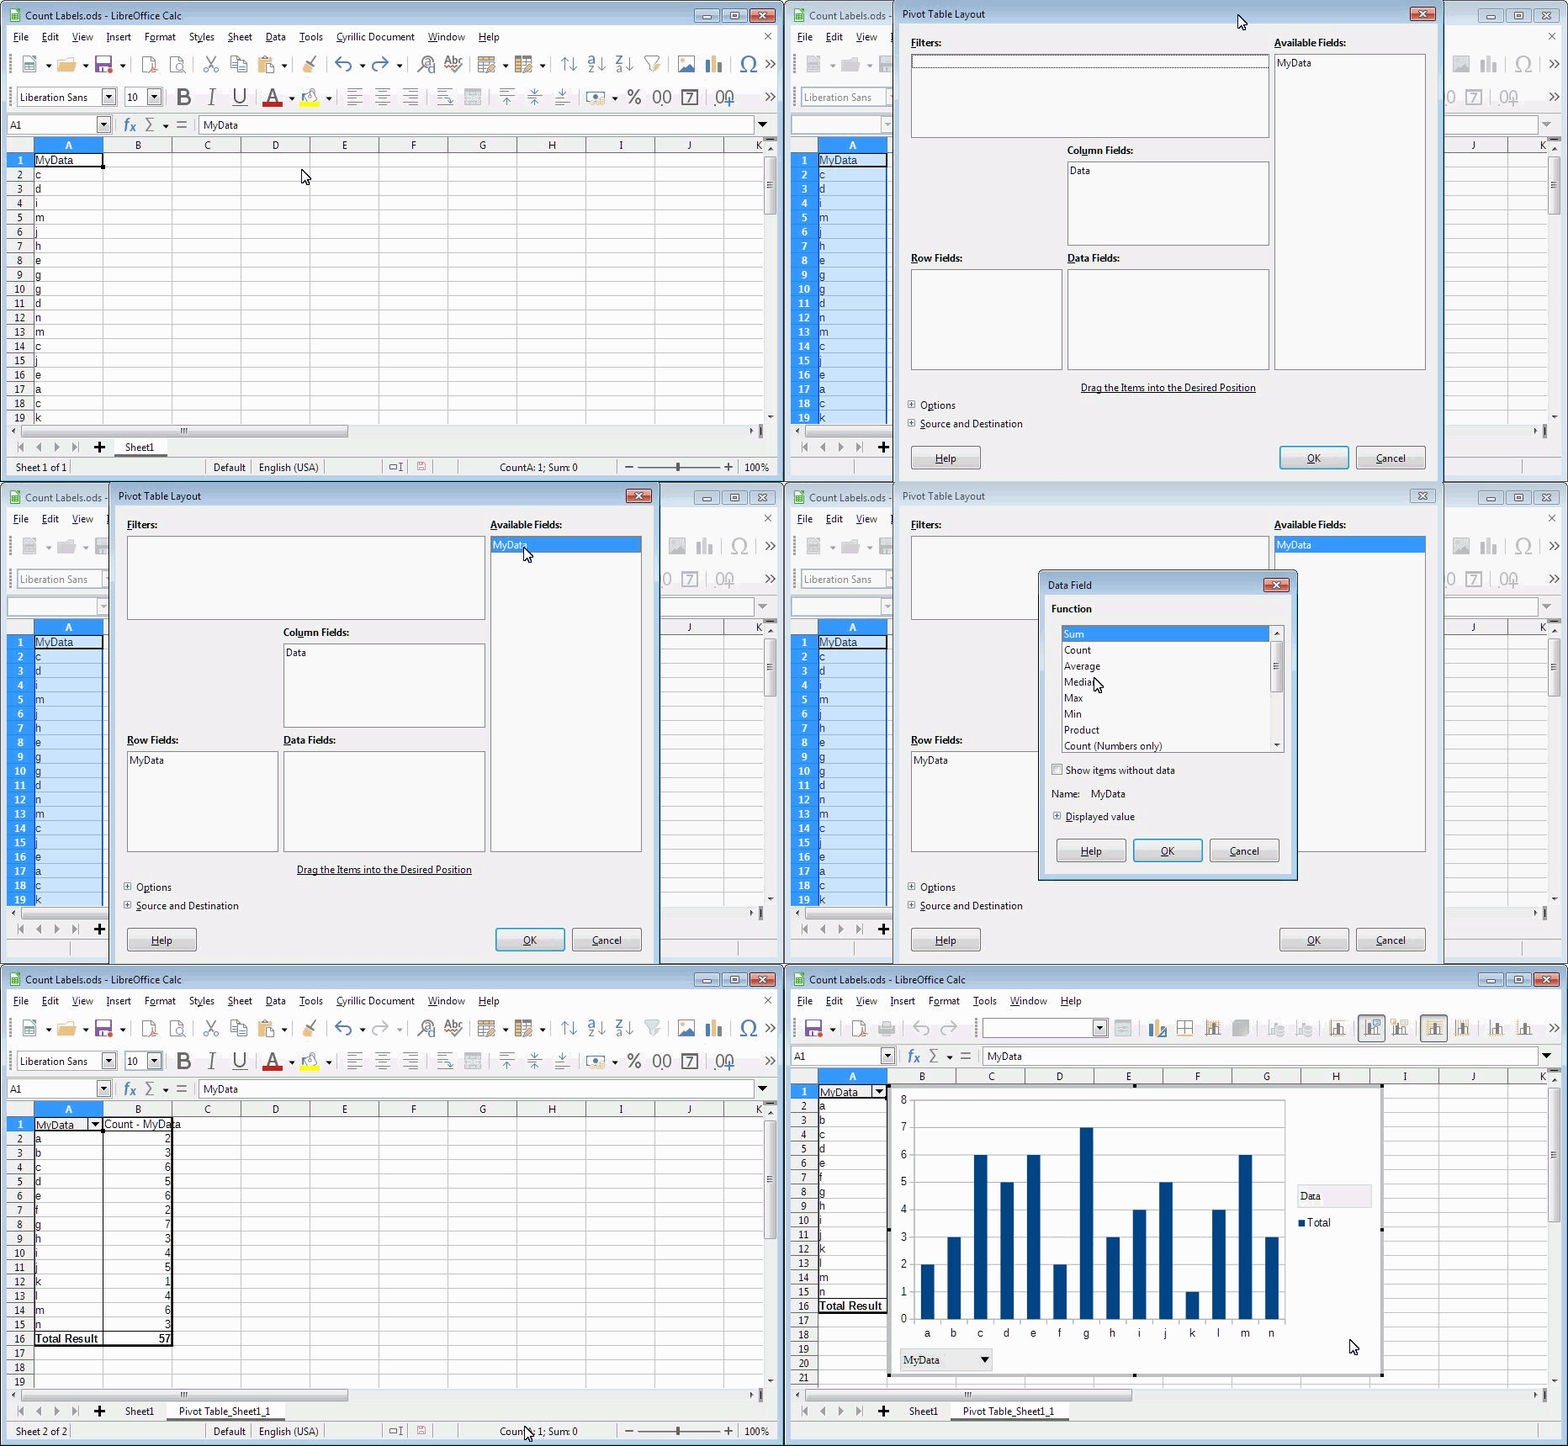
It’s simple, fast and easy to do with the PivotTable:

To create a pivot table, I used the option from the insert column: insert->pivot table…

Sample Data
a
a
a
b
b
b
b
b
z
z
z
z
It’s simple, fast and easy to do with the PivotTable:

To create a pivot table, I used the option from the insert column: insert->pivot table…