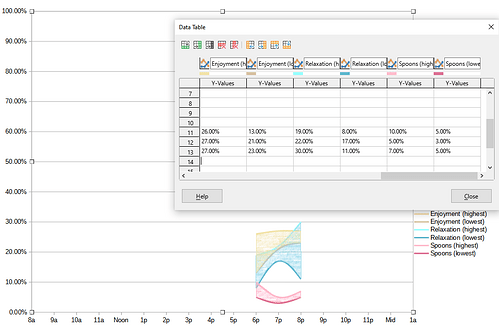
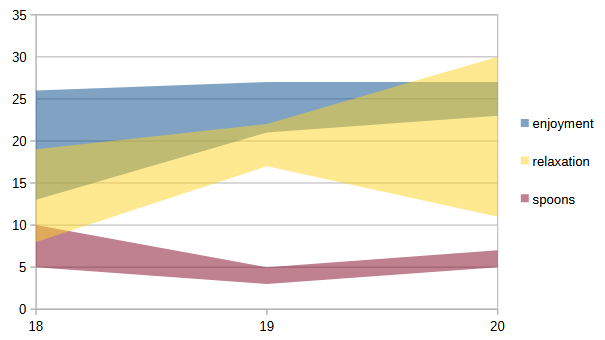
So I’m trying to graph little ribbons of varying areas, at several points in a day. In this instance, every hour I measure the maximum and minimum amounts of energy I’m feeling, in several different categories (ie, things like mental, physical, emotional, social energy, etc). And I can get Impress to graph it as a line graph for the minimum and maximum amount of spoons I had that hour, for instance, but it doesn’t connect the minimum and maximum lines to make a ribbon in the way I want. So I end up with about 17 different lines, measuring only 11 criteria, because 6 of those criteria have minimum/maximum differences.
If I shift to a stocks graph instead, it will show the minimum and maximum for every stat, but it won’t show the minimum and maximum shifting around, with smooth lines between them. It will just show brackets next to each other.
If I shift to an area graph, or even a bar graph of either sort, it assumes that every single stat’s area begins at the x axis. You can’t form a little ribbon, beginning at 53% and extending to 58%, for instance, that then moves forward an hour and becomes 64% to 75%. I’d personally like the ability to create little ribbons of information, basically connecting the minimum and maximum lines to make little area graphs that overlap in the adjusted-opacity way that the net graphs do.
And at first glance, that sounds easy. But I tried to create those connecting-the-min-and-max-area-ribbons in paint, and the result was so layered that it was very difficult to read. So the opacity of each ribbon’s area would have to be somewhere around 10% or 20%, to be able to read the graphs, when multiple ribbons of information are present.
Additionally, I know I came here to ask for a ribbon graph option, but as far as smooth line graphs, it has always been a bug that I would like to see fixed, that it assumes you went below 0% or above 100%, when you give it percentages to measure smooth lines with. And there’s no way to make it keep the line in the percentages listed, so it just assumes you went off the chart and the line disappears, which is a little frustrating.


