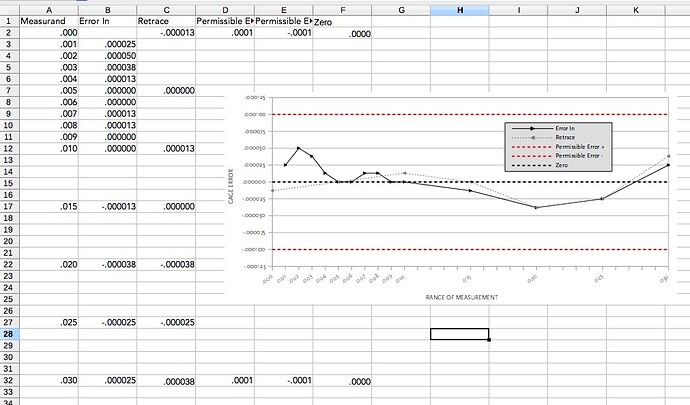
For the purpose of saving space and because that particular series is self-explanatory, I’d like to remove the Name of that series from the legend, but keep its series plot (in this case a straight horizontal line representing zero) in the graph, in my case a Points and Lines chart. Visually, it’s nice to have that zero line as a kind of visual anchor, keeping the more important plotted series line in perspective. But because the visual line itself is so self-explanatory, it would be unnecessary to include it in the legend. Is this possible?
Also, what exactly is a “Category” in a chart? I believe I understand most of what’s going on in the Data Ranges dialog box—which has taken some time to achieve, I can tell you—but I still don’t know what the “Categories” are and what function they serve. In my charts the Catagories are always just a reiteration of the first column data series.
(Edit: activated screenshot -AK)

