Include column labels of noncontinguous data ranges

Got noncontiguous data ranges to work in single chart data series, but I’m failing to include each range’s adjacent labels.

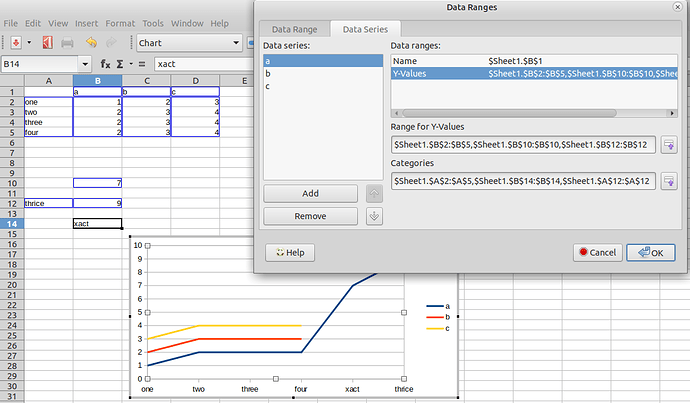
The chart sample stops labelling where the first range ends, with addended ranges missing labels. Please ignore the label format and ticks as irrelevant to the question. From the following illustration, you can see where the ranges join because the labels stop. Also, I confess I don’t really understand what Format/Data Ranges…/Data Series/Name means. Data Ranges/Y-Values makes obvious sense because that’s where my combined data ranges are listed, but Data Ranges/Name, not so much. The unshown data is correct, but here are the axis labels:
Screen Shot 2020-06-05 at 01.31.06.png

A related question helped me understand I needed a comma delimiter, not a semicolon.

skyhook,

It is best to use semicolon. Check your system default in menu Tools - Options… - LibreOffice Calc - Formula - Separators - Function:.

If do you wish, share the file.

Take a look at LibreOffice Help on Chart Wizard - Data Range and related topics.

LG: Ok, I don’t have an opinion on that. Traded the delimiters in my prefs like you detailed, and my test data ranges swapped them automagically.

Withholding the file, but there’s nothing exotic to add, and I have read quite a bit of formal help before posting here.

Hello,

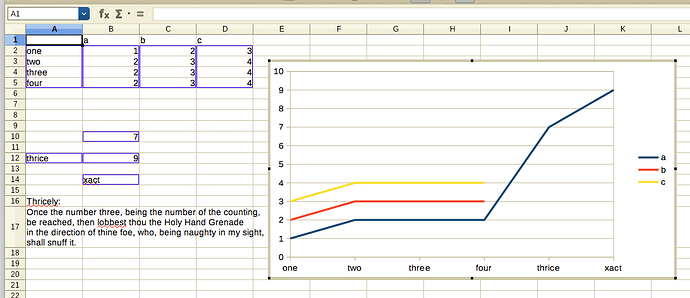
If I understand correctly, this is a matter of both data and labels being non-contiguous. If so tried and found not to be very difficult:

Seems you can place data/labels where wanted.

Just noticed the question may be dealing with data in rows and this example is using columns. Did have problem with data in rows. At least it works when using columns.

@skyhook you should report here → Bugzilla

RS: Thanks, but shouldn’t be rows versus columns. I’m all about columns, for now.

Your illustration is brilliant; I’ll be back in a moment after I finish my concurrent toad-in-a-hole experiment. Instead of my badness, I will recreate your good example. If it works, you will have confirmed I’ve created silliness on my end that deserves a good thwacking.

RS: Not sure what’s happening here, but I created a big response post that disappeared.

To paraphrase my missing answer, you are correct, I apologize for wasting your time, I recreated your example exactly, and I will retreat to my original file to search for my error. Do some answers here disappear once a choice is checked correct?

I also used to use Chart_s a lot some (many) years ago, but I never felt really tempted to define non-comtiguous datar-ranges inside any series.
I always collected the data needed for a Chart neatly (in columns) in advance of creating the Chart itself.
What conclusive reasons should there be to do otherwise?

LP: Thanks, I appreciate that utility and I started that way, but I’ll explain for the curious.

I decided data was too scrolly to keep addending to an infinite column. There are workarounds, and it’s good for a graph, but tedious for browsing. I thought it would be easy to use a letter/pdf size “page” of spreadsheet in each tab, for browsing and output. When a page fills up, I duplicate formatting into a new sheet and start fresh.

I’m mostly there, with hidden cells to hold data range strings, pasting into the graph data range field. Kludgy; I learned fields can’t use named ranges or referred content; must be source cell string. Also, CONCAT can’t automate delimiters. Data is correct, but labels still sad. Can’t seem to display every 100th category as a tick label. Notice the example below, 1 label/data. My list goes on.

I could start 10 questions today alone. Instead, I’m backing off to let my muse catch up. I’ll start 1 new question about viewing large data.

@skyhook: I probably didn’t understand the intentions behind your comment on CONCAT(). At least I cannot find the correct context.
However, TEXTJOIN() might be the means of your choice. (Of course, you may already know it).

LP: Thanks, you are correct. I did not know about TEXTJOIN() features and that is exactly what I imagined, wrongly, that CONCAT could do.

I abandoned my multi-page approach as too error prone, and I rebuilt my file as single columns of data and labels for ease of use. I recreated the simple example volunteered here, but adding complexity required better discipline. I did well using cells to store my range references, but in the end I had a chart that was still messed up somewhere. It became clear that fixing it was adding only complexity. With time and focus it could have been fixed, but I cut bait as my imagined balance of value had shifted. It was a good exercise!

Ah, I can uncheck, create a post, and recheck. Skip the pedantic psychobabble, and now for something completely different: