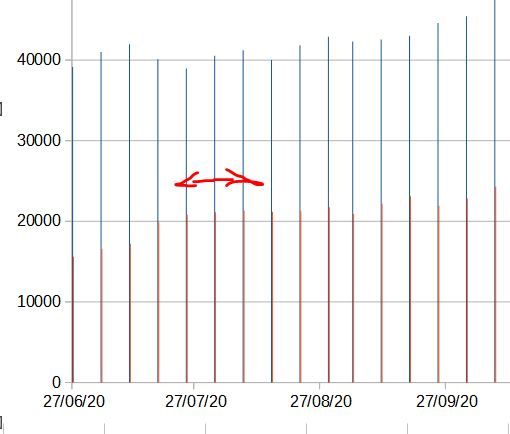
I would like to change the width of the bar in the chart. I have created a bar chart with 3 series to be shown alongside each other. The width of each bar is a thin line and not a bar. I have tried all options and there does not seem to be a way to do this. Can anyone help please?

Hello,
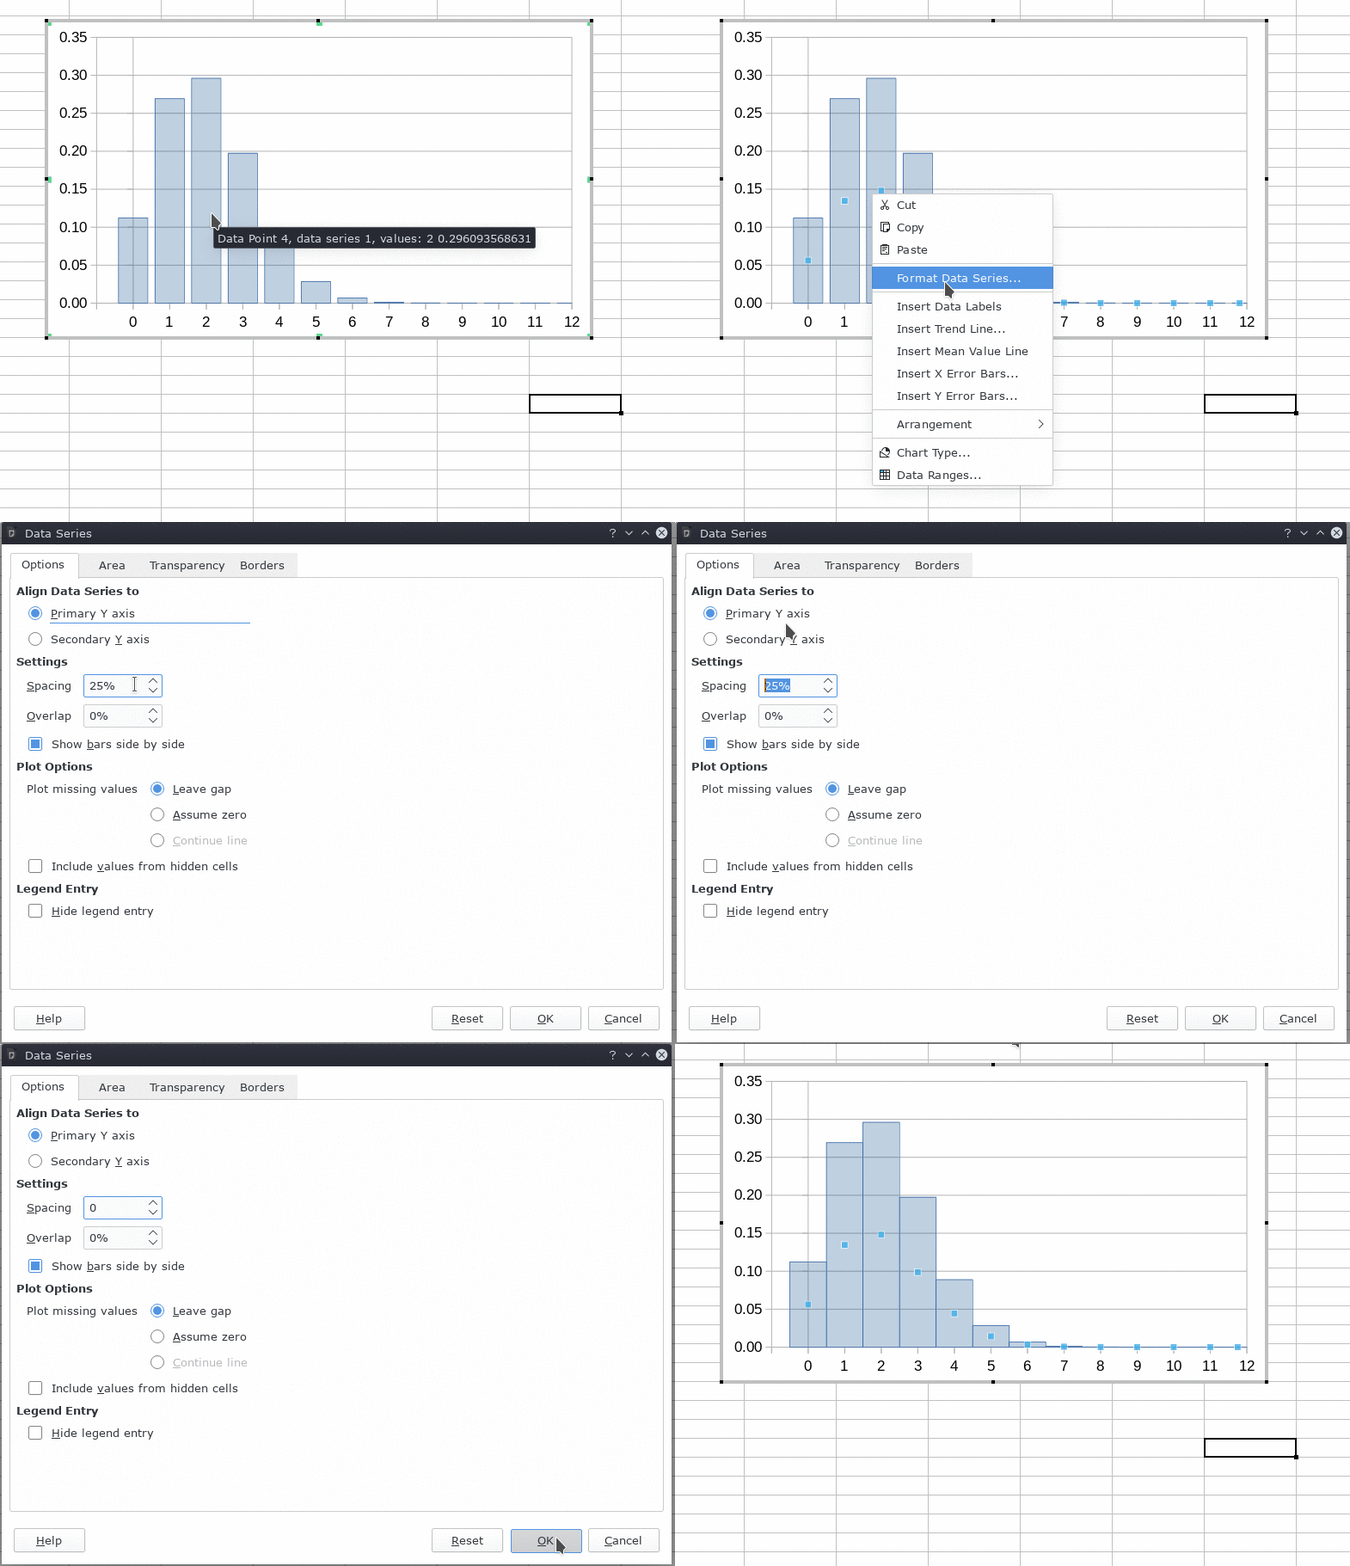
- Enter edit mode (Double click the chart)
- Select a data series
Right click -> Format Data Series -> Tab: Options- Set option Spacing to a lower value

Tested using:
Version: 7.1.0.3 / LibreOffice Community
Build ID: f6099ecf3d29644b5008cc8f48f42f4a40986e4c
CPU threads: 8; OS: Linux 5.3; UI render: default; VCL: kf5
Locale: en-US (en_US.UTF-8); UI: en-US, Calc: threaded
Hope that helps.
Thanks for the very good guide. It did not work initially. I had to change the x-axis type to text as my data is weekly and not daily. All good now.
1 Like
Rudster’s solution is best: change the x-axis type to text.
Other workarounds include:
- deleting the Categories range (but then you’ve got no useful labels),
- changing the “resolution” of the date scale to month instead of day, and
- adding wide borders to the data series format.
