Is it possible to subtract two values from a range of values based on a specific consi

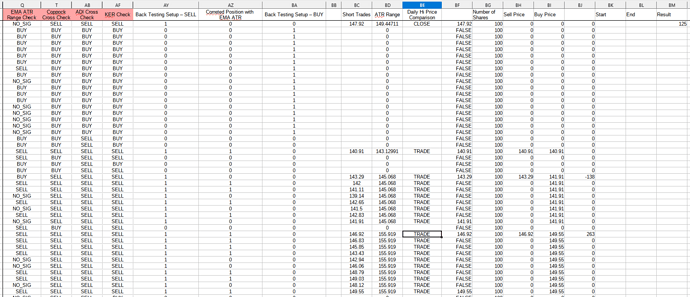
From the Image I have a value of 291.4 on the Low End, and 280.7 on the top end. And I want to know if there is a logic that I can right that does the following:

If (x is a number) and (x -1 == “”), Then the current value = x. This find the starting value.
then I want to substract the previous value from to end value which is denoted by:

if (y is a number and (y+1 == “”), then the end value is y. This will find the starting value.

I want to find a logic that allows me to dynamically perform this calculation without any manual work.

I’m essentially building a back testing spreadsheet. And I’m working if what I an trying to do is achievable without macros.

Many thanks.

I’ve Added a larger view of the data I’m working with.

Do you want those current value/end value pairs running down the side of your list, or do you want to somehow specify one particular series at a time?

If you provide a sample spreadsheet file (preferably with description of expected results) it relieves helpers from creating a sample dataset, possibly misinterpreting your data as we go. A small cutout (like the one we have a picture of) is probably sufficient.

Thanks Keme1 for your response, I’ve added a larger view of some of the data I’m working with.

I have a dynamic way to switch out the different stock data that I’m using.
So i want to quick analyse where all my confirmation indicators give me a buy or sell signal then record that price until the signal changes to the opposite.

Which is why I want to record and start and end price and work out the difference between these two.

An auto repair shop might respond: “It is very difficult to fix a flat tire if we only have a picture of the rim. Please bring the wheel.”

First we need to make a couple of assumptions:

  • You are looking at the “short trades” column. Is that column P?
  • You want your Current value in column X? Your specified “x” is actually column X?
  • Likewise, we want to bring an End value to column Y, right?
  • Now about your field idx, which looks to be column A. Are the numbers starting from 1, so current idx=80 is row 81 in the cell grid?

Based on those assumptions, you could have these formulas

X81: =IF(AND(ISNUMBER(P81);NOT(ISNUMBER(P80)));P81;X80)
Y81: =IF(AND(ISNUMBER(P81);NOT(ISNUMBER(P82)));P81;X82)
Z81: =IF(X81=X80;"---";Y81-X81)

Copy the three cells, and paste up and down the length of your table.

Disclaimer: Formulas are not tested for correctness. Also, even if they are correct, this set of formulas will break if any of the aforementioned assumptions are wrong, if numbers are entered as text data, if your means of switching stock data involves row insertion or deletion, or if the cells which appear as blank contain zero and are formatted to suppress all leading zeroes. This should explain why a spreadsheet file is often better than a picture of a spreadsheet file (which in turn might explain why I started with an auto repair shop analogy).

Your First assumption is correct. I am looking at Column P for the actual value for the price. The Day Hi Comparison column is used to denote where the trade would close if the current days hi breaks the ATR price level. If it did it would say CLOSE rather than TRADE.

Columns BI and BJ area just tests I was doing to see if I can filter the conditions to perform a subtraction to find the difference in the start and end values.

So X in this example would be BJ = 291.4 and Y would be BI = 280.7.

In regards to the cell row idx is the row index.

Because the row range can vary in height depending on how long a trend last, I want to dynamically choose my X and Y values.

I understand it would be difficult to understand the problem. But think from your assumption you understand where I’m trying to get to. I’ll give your examples a try, because they are similar to what i used to filter the ATR Range and the Daily Hi Prices.

@keme1 Thanks again for your time. I’m looking into your suggestions and I’ll let know you what I find. Many thanks.

Hi @keme1, just want to say thanks for your help. You allowed me to rethink my approach in the solution you provided from your assumptions.

As you can see in the screen capture, it is now working as intended. I just need to do some clean up and optimization, like with the shares portion. But the base structure that I was trying to get working now works. So when I switch stock data this all updates on the fly. I just need to do the same for Long trades, and a few condition that need to be checked. At least now I can create the same for a few of my other strategies.


Many thanks again @keme1.