Libreoffice calc chart for events on a timeline

Good day all.

I am a long time user of Libreoffice, and a mainly Linux (Ubuntu / PopOS) user. My issue however is not related to my OS, but rather my failure to complete a task which seems so simple. Let me explain briefly. I have built out a wonderful spreadsheet in 7.6.3.2 (64bit) which I use as a checklist / to do sheet for site management. On this sheet, I have a column A as the check points information (example: Cell A3 contains: Has this been done, Cell A4 contains: Has that been done, and so on and on). Relative to this in the same row in cells in column D, I use this for information about status or updates on cells in column A. Now I have also found a handy way to date & time stamp any entries in cell D to Cell C with the formula: =IF(D3="","",IF(C3="",NOW(),C3))
What this does is put in the date and time in cell C of the same row if I enter data into cell D on the same row.
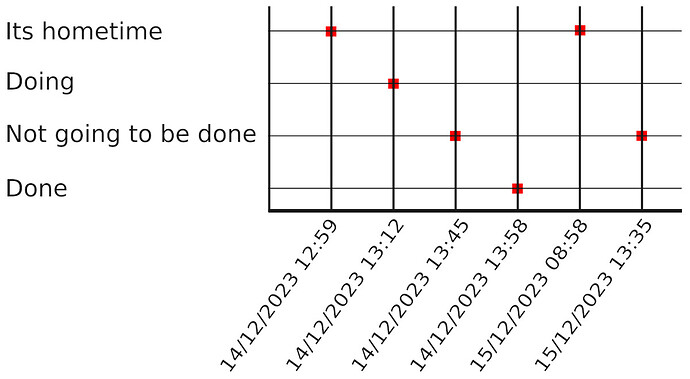
Now, I was hoping to create a chart that has an Axis X of my timestamps and plots on the chart to the relevant change. Example, on 14 December 2023 at 12:03 I updated cell D3 for A3 (Has this been done). The datestamp was entered into cell C. My chart should plot the action. And so on. Now besides not being able to understand how to do this, I am wondering, how will this play over days, weeks etc. Because tomorrow there will be changes. Could it be a ticker type chart? I do not mind manually refreshing to get updates. I am no expert so I hope my explanation is clear. I have played with Scatter XY but it insists on putting my datestamp on the Y axis and no labels. I mocked up what I would like it to look like as per the image attached.


Hope this is enough info and makes sense. Thanks for inputs in advance

Please upload your ODF type sample file here.

Scatter graph are for the data-proportional scale of the X axis. The simple Line Graph (what can show only the Points, if you want it ) is may appropriate for you.

Here is my spreadsheet. Nothing sensitive in the sheet.
Example.ods (80.3 KB)
I will look at the line chart as suggested.

I am trying to get events plotted on the datestamps in column C which should be the X axis. So if a change is made and the date updates in say Cell C5, then the chart should show a new entry on the X chart with the time stamp on the X axis. Does this make sense and is it possible? Almost like a stock ticker graph

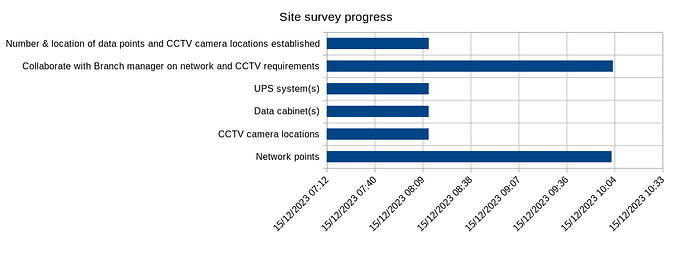
I believe I may have found the best graph now. I will tweak and adjust it, but it is what I want somewhat. It is the Bar graph (see image)

There are some Gantt charts in Extensions, Extensions » Extensions. You might be able to get some hints from their construction although you seem to be there anyway.

1 Like

For the purposes of resolving this, I have concluded 2 options, and both work for my needs:

  1. The XY Scatter chart will work perfectly as long as I can live with the datestamp on the Y axis. The labels being long need to be formatted (Right click on the graph>Edit then Right click on the Axis for labels and select Format Axis (X in this case)(click on the text for the labels to be accurate) then select the tab called Label, tick the options Overlap & Break under Text Flow.
  2. For the Bar graph, apply the same approach if your labels are too long. I just selected to slant my X axis labels (the datestamp) to 32 degrees so they are more readable and do not occupy too much real estate on my chart.

Thanks for the inputs everyone.