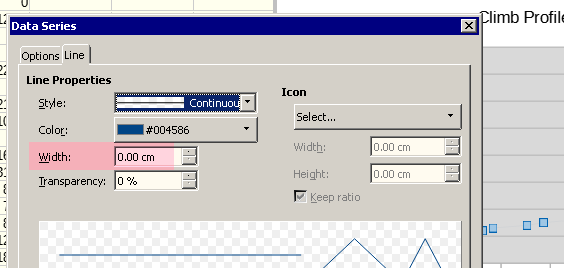
I have a spreadsheet of many self-contained pages each with similar format and each containing a chart. The chart is an x-y scatter graph displayed as ‘line only’. I recently re-opened the file after a long time and found all the chart lines had disappeared. Selecting ‘points’ or ‘points and lines’ make the chart data appear as points, but reverting to lines, the chart is blank again. However I can recover my line by selecting ‘3D-lines’ (which displays correctly) and then reverting to ‘lines only’. Weird or what? A simplified file is attached. I wonder if anyone else has seen anything like this?
Test.ods (38.8 KB)
LO 7.6.0.3; Ubuntu 22.04

