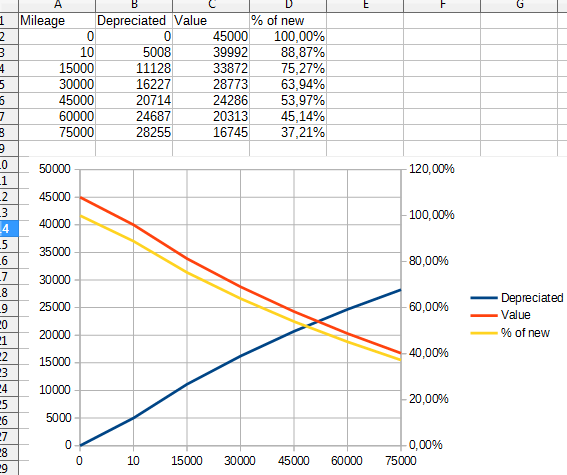
Libre Office Calc 4.2.7.2
OS: Linux Mint 17 (qiana)
I’m trying to learn to make graphs in Libre Office Calc. I thought for exercise, it would be easy to start with a graph showing the depreciation of a new car over time. I would like to graph the mileage on the X-axis, the car value with one line on a y-axis, and the percentage depreciation on the other Y-axis on the right side of the graph. So there will be 2 different colored lines that correspond to two scales – Y-axis (right) and Y-axis (left)
I cannot get the spreadsheet to use the proper data. I’ve been all over help forums and the wiki and still no luck.
Note that I’m not trying to graph the data in the “$'s Depreciated” column, but the other 3 columns, I would like them to be on the graph.
Thank you for any help.
Edit: I notice that I have the formulas wrong in the spreadsheet, but that shouldn’t have any effect on the graph I’m trying to make.

