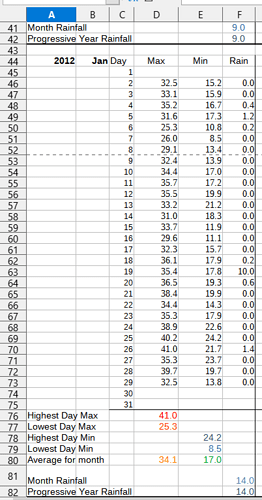
I have set up a weather spreedsheet for daily minimum, maximum and rainfall data in columns. At end of month have set up min max and total rainfall for month as =MIN(E45:E75) =MAX(D45:D75) =SUM(F45:F75).
How do I set up the day within that month the min and max occurred with a blue or red colour?
Use the ConditionalFormat feature. Just create two new Cell Styles with ren and blue background color, and apply it with the CF feature
“The Formula is” (for the first cell, and for the MIN condition) some similar (depends on the structure your data):
E45=MIN($E$45:$E$75)
.
Please upload your ODF type sample file here.
Thanks for the info.
I am relatively new to spreedsheet set up so not sure of Conditional Format feature.
Spreedsheet layout is:
Columns of: Year, Month, Day, Max, Min, Rain as set in below example.
                      Jan        Day  Max         Min        Rain
                                	30	35.6	14.2
                	        31	34.1	14.3
Highest Day Max 41.3
Lowest Day Max 24.8
Highest Day Min 23.9
Lowest Day Min 9.8
Average for month 33.2 15.5
Month Rainfall 0.0
Progressive Year Rainfall 0.0
Please upload a real spreadsheet file here (.ods) instead of the description.
A database query like the following generates a set of min, max and averages for each parameter per month.
SELECT "Year","Month",
MIN("Max")AS"Lowest Max", MAX("Max")AS"Highest Max", Average("Max") AS "Avg Max",
MIN("Min")AS"Lowest Min", MAX("Min")AS"Highest Min",Average("Min") AS "Avg Min",
MIN("Rain")AS"Min Rain", MAX("Rain")AS"Max Rain",Average("Rain") AS "Avg Rain"
FROM "Data"
GROUP BY "Year","Month"
The following query generates a set of day numbers with maximum temperatures for the respective months:
SELECT "A"."Year","A"."Month", "B"."Day"
FROM "Query" AS "A"
JOIN "Data" AS "B" ON "A"."Year"="B"."Year" AND "A"."Month"="B"."Month" AND "A"."Highest Max" = "B"."Max"
A spreadsheet can mimic the first query by means of a pivot table. Queries like the second one can be derived from the pivot table by means of complex array formulas and/or SUMPRODUCT formulas.
A spreadsheet is not a database, not even close. Storing real life data in spreadsheets is a mistake.
Download
t89379.odb (3.3 KB)
Compile a spreadsheet table with 4 columns date, max, min, rain and copy the cell range.
Select the table icon “DATA” and paste.
Check “contains column labels” if your copied data includes column labels, click [Next] and make sure that the columns match.
Open query “Highest maximums per month” to see a result. It is based on “Query1” which pulls the monthly minimums, maximums and averages from the data table.
Thanks for the odb file but unable to open it as I am getting a script error when downloading Java Runtime Environment (JRE) to my laptop using Windows 10. Unable to start a database until I download this JRE.
Attached is my spreedsheet layout. I can get the min, max and rainfall data at end of month, but was trying to achieve the actual day the max and min readings occurred.
Please upload your REAL .ods sample file here.
Why people upload screen shots instead of the real thing is beyond me.
t89379_Firebird.odb (3.3 KB) (non-Java database)
Convert the years, months, days into dates =VALUE($A$44&"-"&B$44&"-"&C45) and format the results as ISO compliant dates YYYY-MM-DD before copying the dates and numbers into the database.
Splitting up data entry of a test series into many tables is always a mistake. Software can do that way better.
Sorry, I do not understand what you are after. Can you explain.
I down loaded the JRE file but when opening it I get a scrip message. Not sure why.

