Multi range line graph in calc basic

Based on what I found here I can generate a graph of one range of data in a spreadsheet using the call:

oCharts.addNewByName(sName, oRect, Array(oAddress), False, True) where oAddress is the return of oRange.getRangeAddress().

The definition of the parameter I called oAddress is
sequence< com::sun::star::table::CellRangeAddress >

To graph multiple ranges of data I tried passing the data as an array of RangeAddresses and also as an array of arrays with a single rangeAddress in the secondary arrays. Both crashed calc forcing it to reload itself.

Undoubtedly part of my problem is that I don’t understnd how LO/OO uses the term ‘sequence’ nor what the rules are for manipulating/generating them.

An explanation or reference would be helpful, lacking that if someone can explain how in basic to generate a line chart including multiple rows of data or a pointer to same I’d appreciate it.

Thanks,
Mike

Ratslinger pointed out that my wording lacked clarity. Hence the mods.Thank you

Hello,

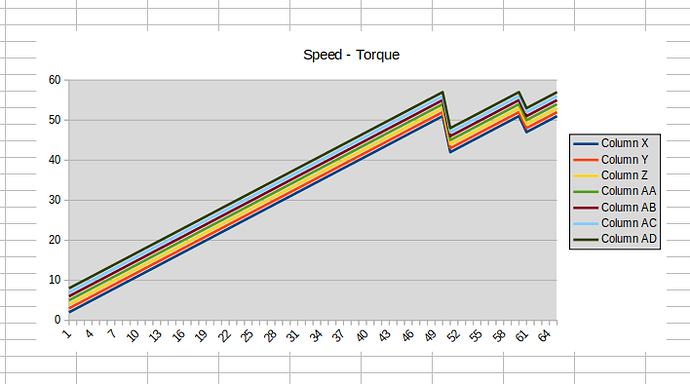
The sample you point to uses many rows and columns for the data: W71:AD120. There are seven lines (from columns) with 50 rows of data in that chart. What rows and columns are you trying to use?

Also trying to understand what you are referring to when using sequence? A CellRangeAddress consists of a starting Column/Row and has an ending Column/Row. Maybe this is the sequence you refer to.

Yes it does use multiple rows and columns of data but it’s all in a single range.
What I want is to graph data in distinct ranges, in other words, non adjacent rows in a spread sheet.

I, too, find the use of sequence in LO/OO documentation confusing. It’s a UNO data type as listed here: UNO data types but I’ve found no definition or illustration how to handle it.

I used the term ‘sequence’ because it is used in the definition of charts.addNewByName and when I pass an array of CellRangeAddress to charts.addNewByName calc crashes.

I hope that makes things clearer.

Mike

Hello,

Your new information makes a big difference in the question. Have not looked closely into non-contiguous areas in charts let alone for the coding to do so. Appears there is some capability. See:

tdf#53300

and

this post → How to enter disjoint cells as y-values in chart

May look at this further later.

Howdy,
Thanks for the thoughts.
Adding a comma to combine multiple ranges suggests to me that the ranges must be expressed in string form as “$Sheet1.A1:A5,$Sheet1.D1:D5”. All my spread sheet is based on R1C1 notation but I can figure out how to convert if that what it takes. oRange,AbsoluteName sort of works but oRange.getRangeAddress() throws a runtime exception if the Sheet is in there it also choked on a comma separating 2 names like “A1:B2,D3:E4” so I’m back where I started wondering how to generate a sequence of cellRangeAddresses in basic.
I appreciate your time though.
Be Well,
Mike

Hello,

It’s amazing how much is forgotten over time. Seems I answered this almost 5 years ago.

See my answer here → Macro change Categories data range

Tested on my chart and had no problem.

Edit:

Will elaborate a bit here as the like may seem confusing.

Here is the code used in my chart:

oData = Array(oSheet.getCellRangeByName( "W71:AD120" ).getRangeAddress(), _
             oSheet.getCellRangeByName( "W125:AD134" ).getRangeAddress(), _
             oSheet.getCellRangeByName( "D2:K6" ).getRangeAddress())
oChart = oCharts.getByName( sName )
oChart.setRanges(oData)

Here is the chart:

The first range goes from 1 to 50; the second from 51 to 60 and the third from 61 to 65.

Ratslinger, that is exactly the help I needed.
I want to be able to select which rows to chart with a mouse so the oData assignment is not fixed I got that working with 2 or 3 ranges, more than that will require adding another phrase to the code and probably won’t be needed any time soon. I did have to move the ‘Array()’ to the assignment of oData rather than to the addNewByName() call but it works well.
I also found your comment on this page helpful:graph-in-calc-with-star-basic
Perhaps one day I’ll come to an understanding of OO/LO sequences and be able to write a routine that builds them on the fly.
Thanks for your help.

Mike

one further question but very off topic:

Is there a way to browse your responses dealing with graphs without having to scroll through all 2671 posts?

Again, Thanks,

Mike

@MikeMcClain46,

No method to my knowledge for you to “easily” search my posts. Can do general search on charts. I can search more easily since I maintain my own database of Questions I have posted to.

Charts are very much the same in different modules such as Calc, Writer, Base. Here are a few (macro related) of possible interest.

Charts in Base forms

use macro to create chart dimensions based on cells, not values - Has link to OOME book.

Inserting Chart using pyuno

Create an updatable link from within Writer to a Calc Chart?

@MikeMcClain46,

Another document is from AOO → Charts

There is a page in that section which eludes to sequences - my impression is a sequence is the values of a row.

Edit:

Think sequence like array. See → Mapping of Sequences and Arrays

Many thanks, especially for the last one on sequences vs arrays, that really helps clear my confusion.
The others will require some study.

You’ve been very helpful.

Be well,
Mike