Dear LibreOffice community,
Could anyone point me in the right direction?
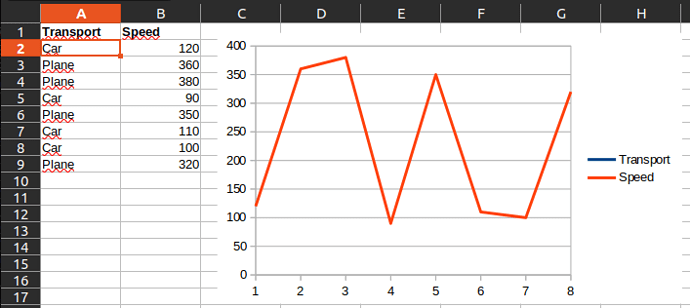
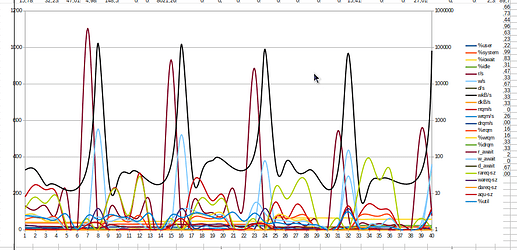
I could not get my head around line chart below, let alone googling the answer.
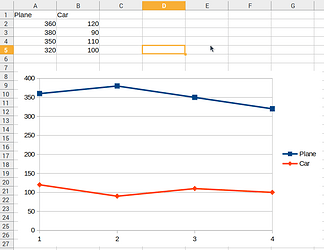
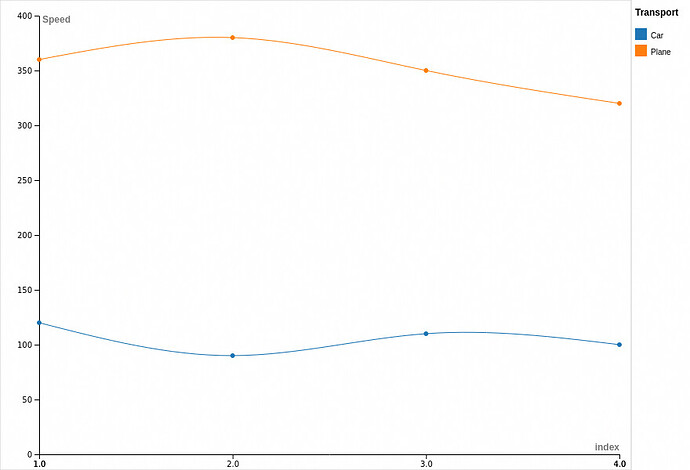
How one plots a line chart with Plane speed line and Car speed line?
There should be two lines on the chart for each transport and four dots respectively:
- blue line for plane speed
- orange line for car speed

