Don’t misunderstand, the challenge is not that I need anybody to justify their preference for databases – I’m seeking advice on whether my application is suitable for building a database AND whether that would easily be of greater flexibility than the spreadsheet I created.
I’ve already asked the Google forum for DB design hints and haven’t yet had time to peruse all 7Billion+ responses. I thought the AskLO forum might provide a tad more focus.
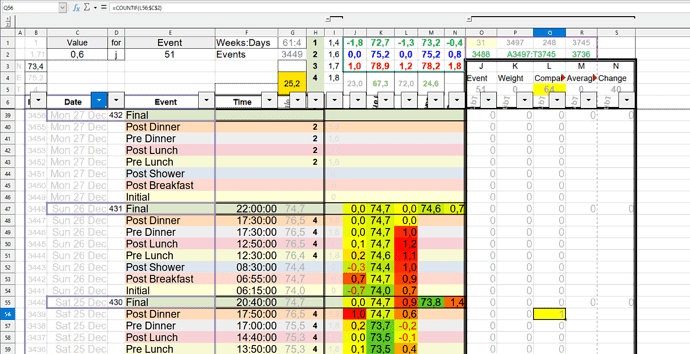
Firstly, when the sheet is extended every month, the rows are sorted ascending on B: and all the formulae and formats are simply copied down. The Array O1:R2 provides information facilitating easy extending.
In daily use, the sheet is sorted descending on Col B: and Cols I, O, P, Q, R & S are hidden.
Clearly, Autofilters permit me to select or exclude range permutations of dates, events, times or entered/calculated values AND the Array J1:N3 provides appropriate SUBTOTALS(). Also, three colour conditional formatting is applied to all the calculated cell values which can visually signify the “spread” over the entire column and representative autofiltered selections.
Of special significance is the Array O3:S “the helpers” which circumvent the Countif() type limitations when working in a SUBTOTAL() array and so accumulates only the “Valid” hits in the directly referenced data cells – observe the yellow highlights Q5 & Q56. AND yes, I realise all the helpers accumulate the chosen value in each of the columns – you will notice this is filtered by the C1:E2 Array. I originally had five independent rows – one for each representative column and each column’s helper was defined to target that column – whereby only the defined target was accumulated in O3:S3
Of particular interest is:-
What are the tables?
Is One day a record or just one event?
Should the calculated values be part of the record or calculated by a reporting function?
I appreciate that the “helpers” would be redundant as a report could simply accumulate the target values – IF the calculations are stored with the record!
As you can see, the cluster of 8 rows between the “Final” events represents 1 day of observations.
The Array B6:E is standard and pre-created every month when I extend the sheet.
The Array F6:H is the only data I enter.
Col I is referenced relative to the contents of Col H and provides the value by which Col G must be adjusted.
Col J is the Col K change against the previous row.
Col K is the calculated value of Col G adjusted for the margin in Col I.
Col L is the calculated change against the previous day’s event.
Col M is the daily moving average of the Col K values.
Col N is the absolute change from Initial K to Final K
My justification for the spreadsheet approach is that LOCalc can be defined to expand all the formula cell links and their integrity is retained during sorting and exclusion actions, unless of course there is a range defined within a nested operation – hence the “clumsy” direct references in the Final Cols M&N.
AND
Everything is in real time, with some charts – which have been moved out of sight – responding immediately to any change or autofilter.


